5-day weather forecast Juan José Castelli Nov 14, 2026

34°24° · Light rain shower

Weather forecast Juan José Castelli Saturday Nov 14, 2026: light rain shower, temperature from 24 °C to 34 °C.

Precipitation probability 84%. Wind up to 5.39 m/s (gusts 11.61 m/s). Air humidity 48–95%, atmospheric pressure 755–758 mm Hg, UV index up to 9.9.

Sunrise 06:05
Sunset 19:27
First Quarter31% illuminated
Moonrise 10:28 · Moonset does not set today
Chart
Table

Forecast from 24 °C to 34 °C and precipitation

Temperature & Precipitation
Time00:0001:0002:0003:0004:0005:0006:0007:0008:0009:0010:0011:0012:0013:0014:0015:0016:0017:0018:0019:0020:0021:0022:0023:00
Temperature (°C)292828282727272830333433333129262727282626252524
Precipitation (mm/hr)000000000000.441.431.192.743.72.211.10.070.130.240.260.160.08

Cloud cover and precipitation probability

Cloud cover & Rain chance
Time00:0001:0002:0003:0004:0005:0006:0007:0008:0009:0010:0011:0012:0013:0014:0015:0016:0017:0018:0019:0020:0021:0022:0023:00
Cloud cover (%)77796459685842414141608099991001009989948594858787
Rain chance (%)1112101011109864636585975847766293652474844

Wind speed and direction

Wind & Wind gust
Time00:0001:0002:0003:0004:0005:0006:0007:0008:0009:0010:0011:0012:0013:0014:0015:0016:0017:0018:0019:0020:0021:0022:0023:00
Wind (m/s)333.113.193.193.53.53.113.8142.110.390.812.194.315.394.393.612.892.191.310.6911.39
Wind gust (m/s)8.118.118.288.228.538.869.068.649.538.537.038.679.6910.8311.4211.619.477.785.835.474.723.974.144.61
Wind direction (°)NE 55°NE 49°NE 47°NE 49°NE 42°NE 43°NE 43°NE 39°NNE 24°NNE 23°NNE 26°NE 56°WNW 299°SSE 148°SE 146°SSE 147°SE 140°SE 127°ESE 111°ESE 108°E 98°E 97°E 87°E 91°

Air humidity

Humidity
Time00:0001:0002:0003:0004:0005:0006:0007:0008:0009:0010:0011:0012:0013:0014:0015:0016:0017:0018:0019:0020:0021:0022:0023:00
Humidity (%)636466676869706659504852596874868582818891939595

Atmospheric pressure

Pressure
Time00:0001:0002:0003:0004:0005:0006:0007:0008:0009:0010:0011:0012:0013:0014:0015:0016:0017:0018:0019:0020:0021:0022:0023:00
Pressure (mm Hg)757757756756755755755756756757757757757757757756755755755756757757758758

Ultraviolet index

UV Index
Time00:0001:0002:0003:0004:0005:0006:0007:0008:0009:0010:0011:0012:0013:0014:0015:0016:0017:0018:0019:0020:0021:0022:0023:00
UV Index00000000.10.72.24.37.69.982.41.80.60.20.20.10000

Air quality & pollen

Air quality
Time00:0001:0002:0003:0004:0005:0006:0007:0008:0009:0010:0011:0012:0013:0014:0015:0016:0017:0018:0019:0020:0021:0022:0023:00
PM2.5 (µg/m³)12.110.69.698.88.88.78.68.47.97.57.27.17.27.610.812.111.911.510.79.57.976.7
PM10 (µg/m³)12.410.99.99.29.198.98.78.68.17.77.47.47.57.811.112.412.211.810.99.68.17.16.9
Ozone (O₃) (µg/m³)777166625855556169778286888784828283827770656566
NO₂ (µg/m³)2.52.42.42.42.62.82.82.41.91.41.10.90.91.31.82.22.221.922.22.32.22.1
SO₂ (µg/m³)0.40.40.30.30.30.40.40.40.30.30.30.30.30.30.40.40.40.40.40.40.30.30.30.2
CO (µg/m³)210199179164159159160160161162162162165175188198201201198191180171165160

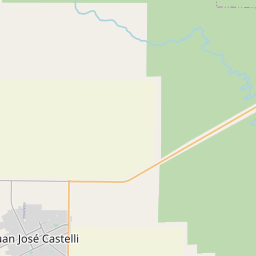
Juan José Castelli on the map

Data Sources & Methodology

Our weather forecasts are powered by a professional weather data provider that aggregates data from national weather services, satellite observations, radar networks, and over 80,000 weather stations worldwide. Forecast data is updated multiple times daily. We convert raw data into clear summaries — wind speed in m/s, pressure in mmHg — so you can plan your day with confidence.