5-day weather forecast Juan José Castelli Nov 13, 2026

42°25° · Sunny

Weather forecast Juan José Castelli tomorrow Nov 13, 2026: sunny, temperature from 25 °C to 42 °C.

Precipitation probability 25%. Wind up to 4 m/s (gusts 10.47 m/s). Air humidity 26–81%, atmospheric pressure 754–759 mm Hg, UV index up to 12.2.

Sunrise 06:06
Sunset 19:27
Waxing Crescent22% illuminated
Moonrise 09:31 · Moonset 23:47
Chart
Table

Forecast from 25 °C to 42 °C and precipitation

Temperature & Precipitation
Time00:0001:0002:0003:0004:0005:0006:0007:0008:0009:0010:0011:0012:0013:0014:0015:0016:0017:0018:0019:0020:0021:0022:0023:00
Temperature (°C)272727262626252729323437394041424139373533313030
Precipitation (mm/hr)0000000.050000000000.030.060.080.060.03000

Cloud cover and precipitation probability

Cloud cover & Rain chance
Time00:0001:0002:0003:0004:0005:0006:0007:0008:0009:0010:0011:0012:0013:0014:0015:0016:0017:0018:0019:0020:0021:0022:0023:00
Cloud cover (%)21241125198411614791623386663626079343875
Rain chance (%)45568825852111123617171794510

Wind speed and direction

Wind & Wind gust
Time00:0001:0002:0003:0004:0005:0006:0007:0008:0009:0010:0011:0012:0013:0014:0015:0016:0017:0018:0019:0020:0021:0022:0023:00
Wind (m/s)3.112.892.892.692.692.692.612.693.313.693.8943.893.693.393.313.313.53.53.193.193.613.613.39
Wind gust (m/s)8.227.947.947.677.367.616.757.57.567.868.118.368.337.56.866.426.567.037.868.789.8310.479.869.06
Wind direction (°)NE 56°ENE 57°ENE 60°ENE 61°ENE 60°NE 55°ENE 66°ENE 60°NE 52°NE 44°NNE 32°NNE 22°NNE 16°NNE 21°NNE 28°NE 41°ENE 57°ENE 71°E 81°ENE 76°ENE 71°ENE 61°ENE 57°NE 52°

Air humidity

Humidity
Time00:0001:0002:0003:0004:0005:0006:0007:0008:0009:0010:0011:0012:0013:0014:0015:0016:0017:0018:0019:0020:0021:0022:0023:00
Humidity (%)656769707375817667554740333128262730354147535659

Atmospheric pressure

Pressure
Time00:0001:0002:0003:0004:0005:0006:0007:0008:0009:0010:0011:0012:0013:0014:0015:0016:0017:0018:0019:0020:0021:0022:0023:00
Pressure (mm Hg)758758758758758758758759759759759758758757756755755755754755755756756757

Ultraviolet index

UV Index
Time00:0001:0002:0003:0004:0005:0006:0007:0008:0009:0010:0011:0012:0013:0014:0015:0016:0017:0018:0019:0020:0021:0022:0023:00
UV Index00000000.20.92.75.58.711.312.211.494.91.60.90.10000

Air quality & pollen

Air quality
Time00:0001:0002:0003:0004:0005:0006:0007:0008:0009:0010:0011:0012:0013:0014:0015:0016:0017:0018:0019:0020:0021:0022:0023:00
PM2.5 (µg/m³)98.387.46.96.97.17.27.17.289.29.710.310.711.211.612.113.515.316.616.915.814
PM10 (µg/m³)9.28.58.17.5777.27.27.27.38.19.510.110.711.111.612.112.714.115.917.217.416.314.4
Ozone (O₃) (µg/m³)727069676257556069788490951001031071111141151131081029485
NO₂ (µg/m³)1.91.71.71.82.33.13.42.91.91.20.90.80.80.80.911.21.41.72.22.83.132.7
SO₂ (µg/m³)0.30.30.30.30.30.30.30.30.30.30.30.30.30.30.40.40.40.40.40.50.60.60.60.5
CO (µg/m³)165165165165163162161163166170176182186184180182199221232217189172181200

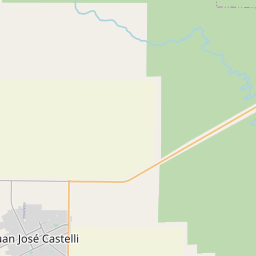
Juan José Castelli on the map

Data Sources & Methodology

Our weather forecasts are powered by a professional weather data provider that aggregates data from national weather services, satellite observations, radar networks, and over 80,000 weather stations worldwide. Forecast data is updated multiple times daily. We convert raw data into clear summaries — wind speed in m/s, pressure in mmHg — so you can plan your day with confidence.