5-day weather forecast Johannesburg Nov 20, 2026

29°19° · Partly cloudy

Weather forecast Johannesburg Friday Nov 20, 2026: partly cloudy, temperature from 19 °C to 29 °C.

Precipitation probability 36%. Wind up to 4.11 m/s (gusts 9.42 m/s). Air humidity 28–71%, atmospheric pressure 759–764 mm Hg, UV index up to 13.6.

Sunrise 05:08
Sunset 18:38
Waxing Gibbous89% illuminated
Moonrise 14:38 · Moonset 02:00
Chart
Table

Forecast from 19 °C to 29 °C and precipitation

Temperature & Precipitation
Time00:0001:0002:0003:0004:0005:0006:0007:0008:0009:0010:0011:0012:0013:0014:0015:0016:0017:0018:0019:0020:0021:0022:0023:00
Temperature (°C)232222212121212325262829292829282825242321202019
Precipitation (mm/hr)000000.1800000000.020.0300.020.330.470.440.110.050.10.37

Cloud cover and precipitation probability

Cloud cover & Rain chance
Time00:0001:0002:0003:0004:0005:0006:0007:0008:0009:0010:0011:0012:0013:0014:0015:0016:0017:0018:0019:0020:0021:0022:0023:00
Cloud cover (%)453127232455256363516055535284617383827875716762
Rain chance (%)43333173554444495736363618171736

Wind speed and direction

Wind & Wind gust
Time00:0001:0002:0003:0004:0005:0006:0007:0008:0009:0010:0011:0012:0013:0014:0015:0016:0017:0018:0019:0020:0021:0022:0023:00
Wind (m/s)2.53.53.192.612.693.613.894.113.813.613.893.893.893.393.393.1933.52.6122.19111.81
Wind gust (m/s)6.0877.257.537.588.069.039.428.838.758.759.118.728.087.757.477.398.788.146.676.334.676.365.06
Wind direction (°)NNW 342°NW 324°NW 320°NW 317°NW 317°NW 315°WNW 302°WNW 291°WNW 288°WNW 290°WNW 289°WNW 288°WNW 289°WNW 282°W 278°W 277°W 274°WSW 253°WSW 256°SW 222°S 174°SSE 149°NNE 28°NE 40°

Air humidity

Humidity
Time00:0001:0002:0003:0004:0005:0006:0007:0008:0009:0010:0011:0012:0013:0014:0015:0016:0017:0018:0019:0020:0021:0022:0023:00
Humidity (%)434446474748474340353229282928303140455161636671

Atmospheric pressure

Pressure
Time00:0001:0002:0003:0004:0005:0006:0007:0008:0009:0010:0011:0012:0013:0014:0015:0016:0017:0018:0019:0020:0021:0022:0023:00
Pressure (mm Hg)761761761761761761762762762762762761761761760760759760761762763763764764

Ultraviolet index

UV Index
Time00:0001:0002:0003:0004:0005:0006:0007:0008:0009:0010:0011:0012:0013:0014:0015:0016:0017:0018:0019:0020:0021:0022:0023:00
UV Index0000000.2136.29.912.913.68.13.72.32.10.20.100000

Air quality & pollen

Air quality
Time00:0001:0002:0003:0004:0005:0006:0007:0008:0009:0010:0011:0012:0013:0014:0015:0016:0017:0018:0019:0020:0021:0022:0023:00
PM2.5 (µg/m³)30.323.719.316.214.11313.417.814.311.910.410.79.79.38.98.47.99.71212.114.717.919.319.4
PM10 (µg/m³)31.825.320.817.715.514.314.719.114.812.410.810.9109.69.28.78.21012.312.314.81819.519.6
Ozone (O₃) (µg/m³)3341474848547295113119120120123126126121112100836448383229
NO₂ (µg/m³)45.336.328.723.72017.215.715.11411.68.76.44.83.74.26.81115.92228.834.538.641.643
SO₂ (µg/m³)48.837.628.52421.720.721.323.224.122.920.718.416.113.812.512.413.416.121.729.135.640.544.447.1
CO (µg/m³)524387291257263273282296297272233204192189192190195240370540652657603535

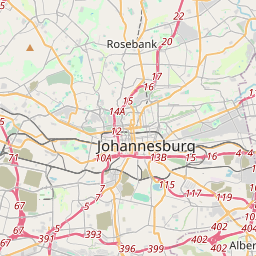
Johannesburg on the map

Data Sources & Methodology

Our weather forecasts are powered by a professional weather data provider that aggregates data from national weather services, satellite observations, radar networks, and over 80,000 weather stations worldwide. Forecast data is updated multiple times daily. We convert raw data into clear summaries — wind speed in m/s, pressure in mmHg — so you can plan your day with confidence.