5-day weather forecast Ipswich Nov 10, 2026

11°7° · Overcast

Weather forecast Ipswich Tuesday Nov 10, 2026: overcast, temperature from 7 °C to 11 °C.

Precipitation probability 63%. Wind up to 5.61 m/s (gusts 8.83 m/s). Air humidity 63–88%, atmospheric pressure 755–761 mm Hg, UV index up to 1.

5 days at a glance — tap a day to open it
Sunrise 07:06
Sunset 16:11
New Moon3% illuminated
Moonrise 09:06 · Moonset 16:12
Chart
Table

Forecast from 7 °C to 11 °C and precipitation

Temperature & Precipitation
Time00:0001:0002:0003:0004:0005:0006:0007:0008:0009:0010:0011:0012:0013:0014:0015:0016:0017:0018:0019:0020:0021:0022:0023:00
Temperature (°C)8887887889111111111110101091010101111
Precipitation (mm/hr)0000000000000000000.42000.4700.01

Cloud cover and precipitation probability

Cloud cover & Rain chance
Time00:0001:0002:0003:0004:0005:0006:0007:0008:0009:0010:0011:0012:0013:0014:0015:0016:0017:0018:0019:0020:0021:0022:0023:00
Cloud cover (%)761005565175078938664248974631001001001001008699100100100
Rain chance (%)22261620121524222017614161016232020591619631919

Wind speed and direction

Wind & Wind gust
Time00:0001:0002:0003:0004:0005:0006:0007:0008:0009:0010:0011:0012:0013:0014:0015:0016:0017:0018:0019:0020:0021:0022:0023:00
Wind (m/s)2.8133.393.313.613.693.6144.114.815.195.615.315.315.114.894.8155.115.55.394.695.315.19
Wind gust (m/s)4.6944.615.394.814.895.615.256.118.196.56.428.336.146.038.337.618.198.838.728.728.338.227.92
Wind direction (°)ENE 78°ENE 61°ENE 67°E 81°ENE 70°ENE 73°E 89°E 88°E 92°E 100°ESE 103°ESE 104°ESE 105°E 101°E 98°E 96°E 89°E 89°E 97°E 92°E 93°ESE 104°E 93°E 91°

Air humidity

Humidity
Time00:0001:0002:0003:0004:0005:0006:0007:0008:0009:0010:0011:0012:0013:0014:0015:0016:0017:0018:0019:0020:0021:0022:0023:00
Humidity (%)868382878282888078816663746364787272847172857070

Atmospheric pressure

Pressure
Time00:0001:0002:0003:0004:0005:0006:0007:0008:0009:0010:0011:0012:0013:0014:0015:0016:0017:0018:0019:0020:0021:0022:0023:00
Pressure (mm Hg)761761761760760760759760760759760760758759758757758758756757757755756756

Ultraviolet index

UV Index
Time00:0001:0002:0003:0004:0005:0006:0007:0008:0009:0010:0011:0012:0013:0014:0015:0016:0017:0018:0019:0020:0021:0022:0023:00
UV Index0000000000.30.60.910.80.50.200000000

Air quality & pollen

Air quality
Time00:0001:0002:0003:0004:0005:0006:0007:0008:0009:0010:0011:0012:0013:0014:0015:0016:0017:0018:0019:0020:0021:0022:0023:00
PM2.5 (µg/m³)212120.319.220.118.917.819.517.816.316.31514.114.514.814.916.214.815.316.516.51615.513.8
PM10 (µg/m³)23.42322.622.221.420.320.421.921.219.619.118.217.517.618.919.318.717.918.419.519.719.62016.8
Ozone (O₃) (µg/m³)3334343128242529443753576062636259575649495245.536
NO₂ (µg/m³)11.19.88.88.18.39.611.815.319.91813.211.510.39.910.711.913.31416.417.817.314.416.520.8
SO₂ (µg/m³)1.31.110.90.911.21.61.91.92.11.81.61.51.61.41.21.11.31.31.21.21.61.8
CO (µg/m³)205203206208207204199201217224227228224209215205209203209225224217214.3216.5

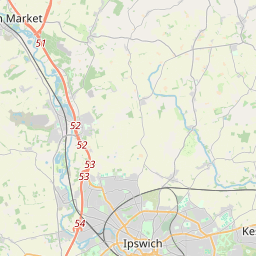
Ipswich on the map

Data Sources & Methodology

Our weather forecasts are powered by a professional weather data provider that aggregates data from national weather services, satellite observations, radar networks, and over 80,000 weather stations worldwide. Forecast data is updated multiple times daily. We convert raw data into clear summaries — wind speed in m/s, pressure in mmHg — so you can plan your day with confidence.