5-day weather forecast Hyderabad Nov 16, 2026

33°23° · Partly cloudy

Weather forecast Hyderabad Monday Nov 16, 2026: partly cloudy, temperature from 23 °C to 33 °C.

Precipitation probability 6%. Wind up to 3.61 m/s (gusts 6.06 m/s). Air humidity 24–38%, atmospheric pressure 758–761 mm Hg, UV index up to 5.3.

Sunrise 06:44
Sunset 17:38
First Quarter52% illuminated
Moonrise 12:32 · Moonset 23:48
Chart
Table

Forecast from 23 °C to 33 °C and precipitation

Temperature & Precipitation
Time00:0001:0002:0003:0004:0005:0006:0007:0008:0009:0010:0011:0012:0013:0014:0015:0016:0017:0018:0019:0020:0021:0022:0023:00
Temperature (°C)262525242323232323262830313233333231302928272625
Precipitation (mm/hr)00000000000000000.010000000

Cloud cover and precipitation probability

Cloud cover & Rain chance
Time00:0001:0002:0003:0004:0005:0006:0007:0008:0009:0010:0011:0012:0013:0014:0015:0016:0017:0018:0019:0020:0021:0022:0023:00
Cloud cover (%)453119222526201611656816323971424037362681
Rain chance (%)322222211111112263322211

Wind speed and direction

Wind & Wind gust
Time00:0001:0002:0003:0004:0005:0006:0007:0008:0009:0010:0011:0012:0013:0014:0015:0016:0017:0018:0019:0020:0021:0022:0023:00
Wind (m/s)2.692.8932.892.812.8133.313.613.613.393.192.692.392.112.392.8932.692.692.391.310.390
Wind gust (m/s)4.834.924.784.644.754.585.085.696.065.9766.035.585.064.924.754.975.615.365.3653.862.832
Wind direction (°)NNE 19°NNE 16°NNE 13°N 10°N 11°NNE 14°N 11°N 6°N 6°NNE 17°NNE 26°NE 39°NE 47°NE 50°NE 44°NNE 32°NE 36°NE 39°NNE 33°NNE 33°NE 39°NE 51°NE 49°NNE 26°

Air humidity

Humidity
Time00:0001:0002:0003:0004:0005:0006:0007:0008:0009:0010:0011:0012:0013:0014:0015:0016:0017:0018:0019:0020:0021:0022:0023:00
Humidity (%)363738383838363533302827272625242424252526272932

Atmospheric pressure

Pressure
Time00:0001:0002:0003:0004:0005:0006:0007:0008:0009:0010:0011:0012:0013:0014:0015:0016:0017:0018:0019:0020:0021:0022:0023:00
Pressure (mm Hg)761760760760760760761761761761761761761759758758758758758759760760760760

Ultraviolet index

UV Index
Time00:0001:0002:0003:0004:0005:0006:0007:0008:0009:0010:0011:0012:0013:0014:0015:0016:0017:0018:0019:0020:0021:0022:0023:00
UV Index000000000.31.22.74.35.35.34.22.61.10.2000000

Air quality & pollen

Air quality
Time00:0001:0002:0003:0004:0005:0006:0007:0008:0009:0010:0011:0012:0013:0014:0015:0016:0017:0018:0019:0020:0021:0022:0023:00
PM2.5 (µg/m³)36.638.239.539.840.239.939.939.239.237.53634.933.932.430.428.727.528.232.134.935.534.833.431.7
PM10 (µg/m³)50.853.354.253.152.652.251.24745.144.544.744.744.944.743.341.239.537.840.241.941.439.837.835.6
Ozone (O₃) (µg/m³)504845423835322934527798111120124121114103887056515150
NO₂ (µg/m³)12.813.914.714.814.814.715.115.414.7128.35.23.32.222.94.9813.52024.123.520.417.6
SO₂ (µg/m³)5.95.965.95.85.75.65.76.27.79.7111110.39.69.28.88.58.48.58.37.66.75.9
CO (µg/m³)550469406367346377522720819724530372294252244284358427477522564614661670

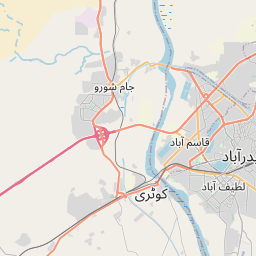
Hyderabad on the map

Data Sources & Methodology

Our weather forecasts are powered by a professional weather data provider that aggregates data from national weather services, satellite observations, radar networks, and over 80,000 weather stations worldwide. Forecast data is updated multiple times daily. We convert raw data into clear summaries — wind speed in m/s, pressure in mmHg — so you can plan your day with confidence.