5-day weather forecast Hisar Nov 16, 2026

28°17° · Sunny

Weather forecast Hisar Monday Nov 16, 2026: sunny, temperature from 17 °C to 28 °C.

Precipitation probability 4%. Wind up to 3.39 m/s (gusts 5.64 m/s). Air humidity 25–65%, atmospheric pressure 759–762 mm Hg, UV index up to 4.5.

Sunrise 06:51
Sunset 17:32
First Quarter52% illuminated
Moonrise 12:38 · Moonset 23:42
Chart
Table

Forecast from 17 °C to 28 °C and precipitation

Temperature & Precipitation
Time00:0001:0002:0003:0004:0005:0006:0007:0008:0009:0010:0011:0012:0013:0014:0015:0016:0017:0018:0019:0020:0021:0022:0023:00
Temperature (°C)201918181817181820222426272828272523222120191818
Precipitation (mm/hr)000000000000000000000000

Cloud cover and precipitation probability

Cloud cover & Rain chance
Time00:0001:0002:0003:0004:0005:0006:0007:0008:0009:0010:0011:0012:0013:0014:0015:0016:0017:0018:0019:0020:0021:0022:0023:00
Cloud cover (%)000000000000000000000000
Rain chance (%)344444443211100001111111

Wind speed and direction

Wind & Wind gust
Time00:0001:0002:0003:0004:0005:0006:0007:0008:0009:0010:0011:0012:0013:0014:0015:0016:0017:0018:0019:0020:0021:0022:0023:00
Wind (m/s)2.112.112.111.891.691.51.191.111.311.611.892.312.693.113.393.393.112.612.52.52.52.52.52.39
Wind gust (m/s)2.722.862.942.642.332.062.172.252.533.564.334.895.255.645.284.894.314.083.723.443.643.473.22
Wind direction (°)N 352°N 352°N 352°N 357°N 356°N 354°NNW 346°NNW 329°NW 314°NW 309°NW 305°WNW 301°WNW 300°WNW 300°WNW 301°WNW 303°WNW 303°WNW 303°WNW 300°WNW 302°NW 304°NW 306°NW 311°NW 312°

Air humidity

Humidity
Time00:0001:0002:0003:0004:0005:0006:0007:0008:0009:0010:0011:0012:0013:0014:0015:0016:0017:0018:0019:0020:0021:0022:0023:00
Humidity (%)596162636465636157504336322825273034363841434547

Atmospheric pressure

Pressure
Time00:0001:0002:0003:0004:0005:0006:0007:0008:0009:0010:0011:0012:0013:0014:0015:0016:0017:0018:0019:0020:0021:0022:0023:00
Pressure (mm Hg)761761761761761761761761762762761761761760759759759759759760760761761761

Ultraviolet index

UV Index
Time00:0001:0002:0003:0004:0005:0006:0007:0008:0009:0010:0011:0012:0013:0014:0015:0016:0017:0018:0019:0020:0021:0022:0023:00
UV Index000000000.51.52.844.542.81.50.50000000

Air quality & pollen

Air quality
Time00:0001:0002:0003:0004:0005:0006:0007:0008:0009:0010:0011:0012:0013:0014:0015:0016:0017:0018:0019:0020:0021:0022:0023:00
PM2.5 (µg/m³)6161.262.463.364.565.768.272.972.968.954.144.239.635.533.631.933.633.83535.735.7363737.4
PM10 (µg/m³)80.877.175.274.774.574.776.880.890.190.183.681.587.893.198.7100.4111.188.280.880.175.969.664.759
Ozone (O₃) (µg/m³)47454441383632283666108138147145139129114100897970645955
NO₂ (µg/m³)20.817.715.615.115.5161718.117.513.683.71.81.42.14.68.311.714.316.618.218.919.119.2
SO₂ (µg/m³)8.87.97.16.565.85.75.86.79.112.214.113.511.6109.28.78.48.28.28.17.77.26.8
CO (µg/m³)298329363366373397469559595527405309267251255290344384390380375383395403

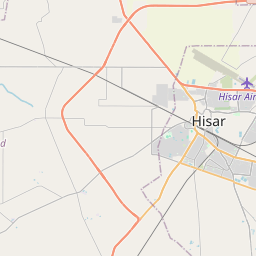
Hisar on the map

Data Sources & Methodology

Our weather forecasts are powered by a professional weather data provider that aggregates data from national weather services, satellite observations, radar networks, and over 80,000 weather stations worldwide. Forecast data is updated multiple times daily. We convert raw data into clear summaries — wind speed in m/s, pressure in mmHg — so you can plan your day with confidence.