5-day weather forecast Hisar Nov 15, 2026

28°20° · Sunny

Weather forecast Hisar tomorrow Nov 15, 2026: sunny, temperature from 20 °C to 28 °C.

Precipitation probability 36%. Wind up to 1.89 m/s (gusts 5.5 m/s). Air humidity 36–69%, atmospheric pressure 759–762 mm Hg, UV index up to 3.

Sunrise 06:50
Sunset 17:32
First Quarter42% illuminated
Moonrise 12:04 · Moonset 22:47
Chart
Table

Forecast from 20 °C to 28 °C and precipitation

Temperature & Precipitation
Time00:0001:0002:0003:0004:0005:0006:0007:0008:0009:0010:0011:0012:0013:0014:0015:0016:0017:0018:0019:0020:0021:0022:0023:00
Temperature (°C)222222212120202021232526272828282725242322222120
Precipitation (mm/hr)0.340.170000.010.060.050.20.050.020000000000000

Cloud cover and precipitation probability

Cloud cover & Rain chance
Time00:0001:0002:0003:0004:0005:0006:0007:0008:0009:0010:0011:0012:0013:0014:0015:0016:0017:0018:0019:0020:0021:0022:0023:00
Cloud cover (%)696865555078817375788033113122819113101
Rain chance (%)36189881418152313103111112222333

Wind speed and direction

Wind & Wind gust
Time00:0001:0002:0003:0004:0005:0006:0007:0008:0009:0010:0011:0012:0013:0014:0015:0016:0017:0018:0019:0020:0021:0022:0023:00
Wind (m/s)0.810.610.390.190.390.690.190.51.51.50.390.390.51.311.691.391.110.810.891.311.391.51.811.89
Wind gust (m/s)1.922.362.031.891.832.362.724.445.55.064.53.723.613.583.423.032.581.861.811.941.941.972.282.44
Wind direction (°)ENE 72°SE 127°E 84°NE 46°NW 312°NW 326°WNW 303°N 357°NNW 347°N 352°N 11°SSE 149°WSW 247°W 270°WNW 282°WNW 289°WNW 294°WNW 282°WNW 302°NW 324°NNW 337°NNW 343°NNW 347°N 350°

Air humidity

Humidity
Time00:0001:0002:0003:0004:0005:0006:0007:0008:0009:0010:0011:0012:0013:0014:0015:0016:0017:0018:0019:0020:0021:0022:0023:00
Humidity (%)586062636567696764575043413836384146485053545657

Atmospheric pressure

Pressure
Time00:0001:0002:0003:0004:0005:0006:0007:0008:0009:0010:0011:0012:0013:0014:0015:0016:0017:0018:0019:0020:0021:0022:0023:00
Pressure (mm Hg)761760760760760760761761762762762761761760759759759759760761761761761761

Ultraviolet index

UV Index
Time00:0001:0002:0003:0004:0005:0006:0007:0008:0009:0010:0011:0012:0013:0014:0015:0016:0017:0018:0019:0020:0021:0022:0023:00
UV Index000000000.31.2232.61.3110.40000000

Air quality & pollen

Air quality
Time00:0001:0002:0003:0004:0005:0006:0007:0008:0009:0010:0011:0012:0013:0014:0015:0016:0017:0018:0019:0020:0021:0022:0023:00
PM2.5 (µg/m³)74.769.262.257.552.946.142.645.846.64643.739.934.53231.130.631.235.341.648.25356.960.561.7
PM10 (µg/m³)89.482.473.668.563.657.353.265.765.462.273.684.372.966.663.15957.25661.265.973.682.488.287.3
Ozone (O₃) (µg/m³)3234374044485153617810011712512912711910592796656514948
NO₂ (µg/m³)40.834.728.924.119.616.214.714.413.210631.40.91.74.48.51318.424.127.727.825.823.4
SO₂ (µg/m³)9.386.96.15.65.35.55.96.57.288.48.27.77.376.76.77.38.18.89.29.59.4
CO (µg/m³)70263558055454153454756655046133624119016920030546362983910581134940604355

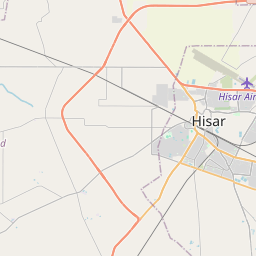
Hisar on the map

Data Sources & Methodology

Our weather forecasts are powered by a professional weather data provider that aggregates data from national weather services, satellite observations, radar networks, and over 80,000 weather stations worldwide. Forecast data is updated multiple times daily. We convert raw data into clear summaries — wind speed in m/s, pressure in mmHg — so you can plan your day with confidence.