5-day weather forecast Hibbing Nov 20, 2026

12°2° · Overcast

Weather forecast Hibbing Friday Nov 20, 2026: overcast, temperature from 2 °C to 12 °C.

Precipitation probability 65%. Wind up to 6.39 m/s (gusts 14.22 m/s). Air humidity 82–98%, atmospheric pressure 752–767 mm Hg, UV index up to 0.9.

5 days at a glance — tap a day to open it
Sunrise 07:23
Sunset 16:30
Waxing Gibbous89% illuminated
Moonrise 14:12 · Moonset 02:43
Chart
Table

Forecast from 2 °C to 12 °C and precipitation

Temperature & Precipitation
Time00:0001:0002:0003:0004:0005:0006:0007:0008:0009:0010:0011:0012:0013:0014:0015:0016:0017:0018:0019:0020:0021:0022:0023:00
Temperature (°C)44322222345568891010101011111112
Precipitation (mm/hr)00000000000000.290.580.870.640.360.180.090.150.10.070.03

Cloud cover and precipitation probability

Cloud cover & Rain chance
Time00:0001:0002:0003:0004:0005:0006:0007:0008:0009:0010:0011:0012:0013:0014:0015:0016:0017:0018:0019:0020:0021:0022:0023:00
Cloud cover (%)10010010010010010010010010010010099100989795979810010099999797
Rain chance (%)303138394242433933312928284659656051493848403733

Wind speed and direction

Wind & Wind gust
Time00:0001:0002:0003:0004:0005:0006:0007:0008:0009:0010:0011:0012:0013:0014:0015:0016:0017:0018:0019:0020:0021:0022:0023:00
Wind (m/s)0.50.691.392.112.312.612.893.313.814.394.815.115.55.55.55.395.395.615.815.815.8966.116.39
Wind gust (m/s)2.332.253.113.754.55.316.197.539.1710.6711.3312.2212.7812.8612.5312.6112.6412.7512.9213.513.9214.1114.0314.22
Wind direction (°)WSW 257°S 174°SSE 158°SSE 152°SE 144°SE 138°SE 134°SE 131°SE 130°SE 129°SE 133°SE 136°SE 140°SE 142°SE 143°SE 145°SSE 151°SSE 158°SSE 163°S 169°S 176°S 180°S 188°SSW 193°

Air humidity

Humidity
Time00:0001:0002:0003:0004:0005:0006:0007:0008:0009:0010:0011:0012:0013:0014:0015:0016:0017:0018:0019:0020:0021:0022:0023:00
Humidity (%)919294979798989795928887868483828485888990919191

Atmospheric pressure

Pressure
Time00:0001:0002:0003:0004:0005:0006:0007:0008:0009:0010:0011:0012:0013:0014:0015:0016:0017:0018:0019:0020:0021:0022:0023:00
Pressure (mm Hg)767767767767767766766765764764763762761759758757756755755754753753752752

Ultraviolet index

UV Index
Time00:0001:0002:0003:0004:0005:0006:0007:0008:0009:0010:0011:0012:0013:0014:0015:0016:0017:0018:0019:0020:0021:0022:0023:00
UV Index0000000000.20.50.30.70.90.70.200000000

Air quality & pollen

Air quality
Time00:0001:0002:0003:0004:0005:0006:0007:0008:0009:0010:0011:0012:0013:0014:0015:0016:0017:0018:0019:0020:0021:0022:0023:00
PM2.5 (µg/m³)11.31.61.41.21.21.522.21.81.31.12.63.23.23.94.54.44.95.34.44.44.44.3
PM10 (µg/m³)11.31.61.41.21.21.522.21.81.31.12.93.63.84.65.355.6655.15.15
Ozone (O₃) (µg/m³)252423222224252628303233364045515764697274767778
NO₂ (µg/m³)3.84.44.95.25.14.74.44.34.143.73.43.23.23.43.53.53.63.53.33.12.92.72.4
SO₂ (µg/m³)0.10.10.10.20.30.40.50.60.70.70.70.60.60.70.911110.90.90.80.80.9
CO (µg/m³)147154163169168164160158156154150145142144148152154155155155154153153152

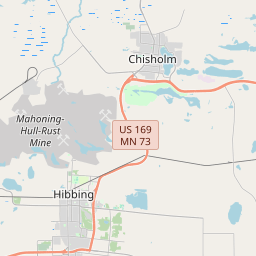
Hibbing on the map

Data Sources & Methodology

Our weather forecasts are powered by a professional weather data provider that aggregates data from national weather services, satellite observations, radar networks, and over 80,000 weather stations worldwide. Forecast data is updated multiple times daily. We convert raw data into clear summaries — wind speed in m/s, pressure in mmHg — so you can plan your day with confidence.