5-day weather forecast Hibbing Nov 19, 2026

7°4° · Overcast

Weather forecast Hibbing tomorrow Nov 19, 2026: overcast, temperature from 4 °C to 7 °C.

Precipitation probability 50%. Wind up to 6.5 m/s (gusts 14.06 m/s). Air humidity 71–91%, atmospheric pressure 756–767 mm Hg, UV index up to 0.3.

5 days at a glance — tap a day to open it
Sunrise 07:22
Sunset 16:31
Waxing Gibbous81% illuminated
Moonrise 13:57 · Moonset 01:36
Chart
Table

Forecast from 4 °C to 7 °C and precipitation

Temperature & Precipitation
Time00:0001:0002:0003:0004:0005:0006:0007:0008:0009:0010:0011:0012:0013:0014:0015:0016:0017:0018:0019:0020:0021:0022:0023:00
Temperature (°C)777766666667777766655554
Precipitation (mm/hr)00.010.110.320.050.110.160.10.050000000.050.020000000

Cloud cover and precipitation probability

Cloud cover & Rain chance
Time00:0001:0002:0003:0004:0005:0006:0007:0008:0009:0010:0011:0012:0013:0014:0015:0016:0017:0018:0019:0020:0021:0022:0023:00
Cloud cover (%)6782599467100100999898989910010010010010010010010010099100100
Rain chance (%)212631502638393325192021232527333028282828282930

Wind speed and direction

Wind & Wind gust
Time00:0001:0002:0003:0004:0005:0006:0007:0008:0009:0010:0011:0012:0013:0014:0015:0016:0017:0018:0019:0020:0021:0022:0023:00
Wind (m/s)5.394.694.394.615.115.55.55.695.815.816.116.396.56.115.554.814.313.893.53.192.8121.11
Wind gust (m/s)1210.5310.2810.4410.8611.3111.2211.4411.7511.8612.6913.3614.0613.4212.511.6110.759.898.427.587.146.585.113.47
Wind direction (°)SSW 192°SSW 201°SSW 202°SW 223°SW 227°SW 231°SW 234°SW 234°SW 235°SW 235°WSW 239°WSW 246°WSW 251°WSW 255°W 263°W 271°W 274°W 274°W 272°W 273°W 278°WNW 285°WNW 285°W 281°

Air humidity

Humidity
Time00:0001:0002:0003:0004:0005:0006:0007:0008:0009:0010:0011:0012:0013:0014:0015:0016:0017:0018:0019:0020:0021:0022:0023:00
Humidity (%)888991898886847974717375788184878786868686868890

Atmospheric pressure

Pressure
Time00:0001:0002:0003:0004:0005:0006:0007:0008:0009:0010:0011:0012:0013:0014:0015:0016:0017:0018:0019:0020:0021:0022:0023:00
Pressure (mm Hg)757756756756757757758758758759759760761761761762764764765766766767767767

Ultraviolet index

UV Index
Time00:0001:0002:0003:0004:0005:0006:0007:0008:0009:0010:0011:0012:0013:0014:0015:0016:0017:0018:0019:0020:0021:0022:0023:00
UV Index0000000000.10.10.20.30.30.10.100000000

Air quality & pollen

Air quality
Time00:0001:0002:0003:0004:0005:0006:0007:0008:0009:0010:0011:0012:0013:0014:0015:0016:0017:0018:0019:0020:0021:0022:0023:00
PM2.5 (µg/m³)4.62.10.30.10.20.30.40.30.40.50.60.50.30.20.30.30.50.50.60.60.60.70.70.8
PM10 (µg/m³)4.62.10.30.10.20.30.40.30.40.50.60.50.30.20.30.30.50.50.60.60.60.70.80.8
Ozone (O₃) (µg/m³)595448444651534941353129283033353533323130292826
NO₂ (µg/m³)32.421.61.41.31.41.72.12.52.72.82.82.52.11.81.71.81.91.922.22.63.2
SO₂ (µg/m³)0.80.80.80.80.80.80.80.80.90.90.80.70.60.50.30.20.10.10.10.10.10.10.10.1
CO (µg/m³)153151147144140136133133135137139141142142141141142142143143142142143144

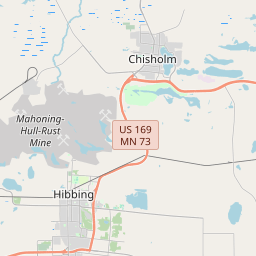
Hibbing on the map

Data Sources & Methodology

Our weather forecasts are powered by a professional weather data provider that aggregates data from national weather services, satellite observations, radar networks, and over 80,000 weather stations worldwide. Forecast data is updated multiple times daily. We convert raw data into clear summaries — wind speed in m/s, pressure in mmHg — so you can plan your day with confidence.