5-day weather forecast Hay River Nov 20, 2026

-4°-11° · Sunny

Weather forecast Hay River Friday Nov 20, 2026: sunny, temperature from -11 °C to -4 °C.

Precipitation probability 43%. Wind up to 2.89 m/s (gusts 8.39 m/s). Air humidity 65–87%, atmospheric pressure 764–769 mm Hg, UV index up to 0.2.

Sunrise 09:59
Sunset 16:57
Waxing Gibbous89% illuminated
Moonrise 15:22 · Moonset 04:33
Chart
Table

Forecast from -11 °C to -4 °C and precipitation

Temperature & Precipitation
Time00:0001:0002:0003:0004:0005:0006:0007:0008:0009:0010:0011:0012:0013:0014:0015:0016:0017:0018:0019:0020:0021:0022:0023:00
Temperature (°C)-4-4-4-4-5-5-5-6-6-7-7-8-8-7-7-7-8-9-10-10-10-11-11-11
Precipitation (mm/hr)0.140.120.090.070.050.030.010.010000000000000000

Cloud cover and precipitation probability

Cloud cover & Rain chance
Time00:0001:0002:0003:0004:0005:0006:0007:0008:0009:0010:0011:0012:0013:0014:0015:0016:0017:0018:0019:0020:0021:0022:0023:00
Cloud cover (%)100999692838572645956433016127222222222
Rain chance (%)43413732282621191817141297656789991011

Wind speed and direction

Wind & Wind gust
Time00:0001:0002:0003:0004:0005:0006:0007:0008:0009:0010:0011:0012:0013:0014:0015:0016:0017:0018:0019:0020:0021:0022:0023:00
Wind (m/s)2.692.612.692.692.692.812.892.692.612.52.392.192.111.891.611.391.391.391.51.892.192.392.52.69
Wind gust (m/s)8.398.087.867.57.337.086.946.866.586.476.255.724.974.393.973.753.833.423.194.114.835.315.285.36
Wind direction (°)N 10°NNE 20°NNE 30°NE 40°NE 46°NE 51°NE 56°ENE 60°ENE 62°ENE 65°ENE 74°E 85°E 97°E 98°E 98°E 98°ESE 108°ESE 117°SE 125°SE 130°SE 132°SE 135°SE 137°SE 137°

Air humidity

Humidity
Time00:0001:0002:0003:0004:0005:0006:0007:0008:0009:0010:0011:0012:0013:0014:0015:0016:0017:0018:0019:0020:0021:0022:0023:00
Humidity (%)878685848483838383838178747068656872757677788182

Atmospheric pressure

Pressure
Time00:0001:0002:0003:0004:0005:0006:0007:0008:0009:0010:0011:0012:0013:0014:0015:0016:0017:0018:0019:0020:0021:0022:0023:00
Pressure (mm Hg)764765765766766766767767767767767768768768768768768768768768769769769769

Ultraviolet index

UV Index
Time00:0001:0002:0003:0004:0005:0006:0007:0008:0009:0010:0011:0012:0013:0014:0015:0016:0017:0018:0019:0020:0021:0022:0023:00
UV Index000000000000.10.20.20.2000000000

Air quality & pollen

Air quality
Time00:0001:0002:0003:0004:0005:0006:0007:0008:0009:0010:0011:0012:0013:0014:0015:0016:0017:0018:0019:0020:0021:0022:0023:00
PM2.5 (µg/m³)0.10.10.10.20.20.20.30.40.40.50.70.80.911.11.21.21.31.41.41.51.51.61.6
PM10 (µg/m³)0.10.20.20.20.30.40.40.50.60.70.91.11.31.41.51.61.71.91.92.12.12.22.22.3
Ozone (O₃) (µg/m³)676869697070707171727374757575757474747373737373
NO₂ (µg/m³)0.10.10.10.10.10.10.10.20.20.20.20.20.20.20.20.30.40.50.50.40.40.40.30.3
SO₂ (µg/m³)00000000.10.10.10.10.10.10.10.10.10.10.10.10.10.10.10.10.1
CO (µg/m³)107107107107107108109110111111112112111110113123137145142133125120115112

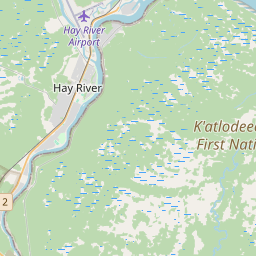
Hay River on the map

Data Sources & Methodology

Our weather forecasts are powered by a professional weather data provider that aggregates data from national weather services, satellite observations, radar networks, and over 80,000 weather stations worldwide. Forecast data is updated multiple times daily. We convert raw data into clear summaries — wind speed in m/s, pressure in mmHg — so you can plan your day with confidence.