5-day weather forecast Chinandega Nov 11, 2026

32°23° · Patchy rain possible

Weather forecast Chinandega tomorrow Nov 11, 2026: patchy rain possible, temperature from 23 °C to 32 °C.

Precipitation probability 61%. Wind up to 2 m/s (gusts 4.69 m/s). Air humidity 62–96%, atmospheric pressure 756–760 mm Hg, UV index up to 10.7.

Sunrise 05:45
Sunset 17:19
Waxing Crescent7% illuminated
Moonrise 07:59 · Moonset 19:29
Chart
Table

Forecast from 23 °C to 32 °C and precipitation

Temperature & Precipitation
Time00:0001:0002:0003:0004:0005:0006:0007:0008:0009:0010:0011:0012:0013:0014:0015:0016:0017:0018:0019:0020:0021:0022:0023:00
Temperature (°C)242424232323232527293031323232313028262525242424
Precipitation (mm/hr)000000000000.010.010.020.030.040.220.390.560.40.250.230.360.03

Cloud cover and precipitation probability

Cloud cover & Rain chance
Time00:0001:0002:0003:0004:0005:0006:0007:0008:0009:0010:0011:0012:0013:0014:0015:0016:0017:0018:0019:0020:0021:0022:0023:00
Cloud cover (%)141413131515161272478858271747477878580857887
Rain chance (%)2021212121201614107613131313153046615545475238

Wind speed and direction

Wind & Wind gust
Time00:0001:0002:0003:0004:0005:0006:0007:0008:0009:0010:0011:0012:0013:0014:0015:0016:0017:0018:0019:0020:0021:0022:0023:00
Wind (m/s)11.111.191.191.311.51.611.611.8121.891.811.690.890.611.391.310.810.110.310.390.610.610.61
Wind gust (m/s)2.032.082.082.112.282.562.923.694.174.584.674.674.694.424.224.063.973.692.642.141.751.581.611.42
Wind direction (°)NE 47°NE 35°NNE 28°NNE 30°NE 42°NE 38°NE 39°NE 38°NE 48°NE 49°NE 49°NE 51°ENE 59°ENE 77°SSE 147°SSW 202°SW 216°SW 231°N 355°NE 53°NE 44°NNE 24°NNE 17°NE 36°

Air humidity

Humidity
Time00:0001:0002:0003:0004:0005:0006:0007:0008:0009:0010:0011:0012:0013:0014:0015:0016:0017:0018:0019:0020:0021:0022:0023:00
Humidity (%)949596969594948982757066626365687786919394959595

Atmospheric pressure

Pressure
Time00:0001:0002:0003:0004:0005:0006:0007:0008:0009:0010:0011:0012:0013:0014:0015:0016:0017:0018:0019:0020:0021:0022:0023:00
Pressure (mm Hg)759758758758758758759759760760760759758758756756756757758758758759759758

Ultraviolet index

UV Index
Time00:0001:0002:0003:0004:0005:0006:0007:0008:0009:0010:0011:0012:0013:0014:0015:0016:0017:0018:0019:0020:0021:0022:0023:00
UV Index00000000.524.77.810.110.79.46.63.61.30.2000000

Air quality & pollen

Air quality
Time00:0001:0002:0003:0004:0005:0006:0007:0008:0009:0010:0011:0012:0013:0014:0015:0016:0017:0018:0019:0020:0021:0022:0023:00
PM2.5 (µg/m³)2119.518.516.915.113.412.712.8116.84.24.24.44.44.75.56.67.79.913.116.515.812.510.2
PM10 (µg/m³)21.520.119.117.515.613.913.113.311.474.44.54.74.85.26.17.28.611.214.617.817.113.710.7
Ozone (O₃) (µg/m³)16151514117112853717778788183868993928473656670
NO₂ (µg/m³)12.211.711.110.510.410.59.77.241.50.70.60.70.60.50.81.52.53.54.86.26.96.45.2
SO₂ (µg/m³)0.90.90.90.90.90.80.80.9110.90.80.70.70.70.70.811.21.31.41.51.61.7
CO (µg/m³)286254219199214245258230184150141143148147149168224298345343314284261236

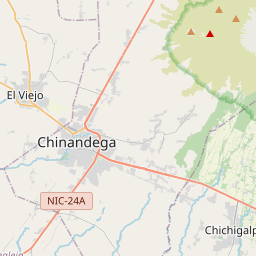
Chinandega on the map

Data Sources & Methodology

Our weather forecasts are powered by a professional weather data provider that aggregates data from national weather services, satellite observations, radar networks, and over 80,000 weather stations worldwide. Forecast data is updated multiple times daily. We convert raw data into clear summaries — wind speed in m/s, pressure in mmHg — so you can plan your day with confidence.