5-day weather forecast Cheonan-si Nov 11, 2026

15°3° · Sunny

Weather forecast Cheonan-si Wednesday Nov 11, 2026: sunny, temperature from 3 °C to 15 °C.

Precipitation probability 19%. Wind up to 2.89 m/s (gusts 6.19 m/s). Air humidity 55–92%, atmospheric pressure 770–771 mm Hg, UV index up to 2.8.

5 days at a glance — tap a day to open it
Sunrise 07:05
Sunset 17:25
Waxing Crescent7% illuminated
Moonrise 09:13 · Moonset 18:32
Chart
Table

Forecast from 3 °C to 15 °C and precipitation

Temperature & Precipitation
Time00:0001:0002:0003:0004:0005:0006:0007:0008:0009:0010:0011:0012:0013:0014:0015:0016:0017:0018:0019:0020:0021:0022:0023:00
Temperature (°C)44444433581012141415151411988677
Precipitation (mm/hr)000000000000000000000000

Cloud cover and precipitation probability

Cloud cover & Rain chance
Time00:0001:0002:0003:0004:0005:0006:0007:0008:0009:0010:0011:0012:0013:0014:0015:0016:0017:0018:0019:0020:0021:0022:0023:00
Cloud cover (%)2900420044001200900300000000
Rain chance (%)151212181313191413107643334781112111313

Wind speed and direction

Wind & Wind gust
Time00:0001:0002:0003:0004:0005:0006:0007:0008:0009:0010:0011:0012:0013:0014:0015:0016:0017:0018:0019:0020:0021:0022:0023:00
Wind (m/s)1.191.110.890.811.391.190.691.111.190.890.890.611.692.112.612.812.892.191.51.3110.390.390.31
Wind gust (m/s)1.781.110.891.581.395.191.335.116.192.533.890.614.53.033.425.473.392.192.724.3111.250.50.39
Wind direction (°)S 184°S 178°S 170°SSE 167°S 172°SSE 154°SE 132°SE 129°SE 141°SE 138°ESE 122°SE 143°W 281°WNW 291°WNW 301°WNW 300°NW 322°NNW 327°NNW 331°WNW 298°WNW 295°W 264°WSW 258°N 2°

Air humidity

Humidity
Time00:0001:0002:0003:0004:0005:0006:0007:0008:0009:0010:0011:0012:0013:0014:0015:0016:0017:0018:0019:0020:0021:0022:0023:00
Humidity (%)878688908990929189797469605956556274778487858889

Atmospheric pressure

Pressure
Time00:0001:0002:0003:0004:0005:0006:0007:0008:0009:0010:0011:0012:0013:0014:0015:0016:0017:0018:0019:0020:0021:0022:0023:00
Pressure (mm Hg)770770770770770770770770771771771770770770770770770770770770770771771771

Ultraviolet index

UV Index
Time00:0001:0002:0003:0004:0005:0006:0007:0008:0009:0010:0011:0012:0013:0014:0015:0016:0017:0018:0019:0020:0021:0022:0023:00
UV Index000000000.10.51.32.12.72.82.21.40.60.1000000

Air quality & pollen

Air quality
Time00:0001:0002:0003:0004:0005:0006:0007:0008:0009:0010:0011:0012:0013:0014:0015:0016:0017:0018:0019:0020:0021:0022:0023:00
PM2.5 (µg/m³)30.92927.326.125.325.125.729.336.233.430.930.229.228.126.92625.225.330.935.640.344.848.852.2
PM10 (µg/m³)38.936.834.933.832.932.933.837.544.541.745.651.649.846.943.540.437.835.740.745.650.454.95962.4
Ozone (O₃) (µg/m³)00000000151426353939362511000000
NO₂ (µg/m³)61.160.159.258.156.855.453.451.148.444.23728.422.620.92226.336.349.558.860.558.355.954.653.3
SO₂ (µg/m³)20.118.116.31514.213.814.21618.620.119.417.716.516.51717.818.519.521.525.330.234.337.339.5
CO (µg/m³)400398386376362349363444552594505351236197197232320442536574584581560526

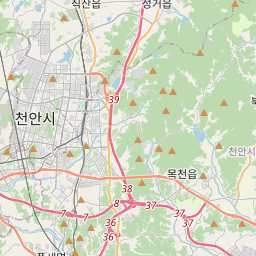
Cheonan-si on the map

Data Sources & Methodology

Our weather forecasts are powered by a professional weather data provider that aggregates data from national weather services, satellite observations, radar networks, and over 80,000 weather stations worldwide. Forecast data is updated multiple times daily. We convert raw data into clear summaries — wind speed in m/s, pressure in mmHg — so you can plan your day with confidence.