5-day weather forecast Chapecó Nov 19, 2026

28°18° · Light rain shower

Weather forecast Chapecó Thursday Nov 19, 2026: light rain shower, temperature from 18 °C to 28 °C.

Precipitation probability 60%. Wind up to 2.19 m/s (gusts 5.89 m/s). Air humidity 67–99%, atmospheric pressure 755–758 mm Hg, UV index up to 11.6.

Sunrise 05:29
Sunset 19:01
Waxing Gibbous81% illuminated
Moonrise 14:20 · Moonset 02:01
Chart
Table

Forecast from 18 °C to 28 °C and precipitation

Temperature & Precipitation
Time00:0001:0002:0003:0004:0005:0006:0007:0008:0009:0010:0011:0012:0013:0014:0015:0016:0017:0018:0019:0020:0021:0022:0023:00
Temperature (°C)191818181818182021222425262727282725232221212121
Precipitation (mm/hr)0.050.070.080.10.230.360.50.40.30.20.150.10.050.030.020.010.090.180.250.170.110.050.040.03

Cloud cover and precipitation probability

Cloud cover & Rain chance
Time00:0001:0002:0003:0004:0005:0006:0007:0008:0009:0010:0011:0012:0013:0014:0015:0016:0017:0018:0019:0020:0021:0022:0023:00
Cloud cover (%)100100100100100827310010093749170737062929699989310010079
Rain chance (%)484951535255596052462928171514112637484648484636

Wind speed and direction

Wind & Wind gust
Time00:0001:0002:0003:0004:0005:0006:0007:0008:0009:0010:0011:0012:0013:0014:0015:0016:0017:0018:0019:0020:0021:0022:0023:00
Wind (m/s)1.11111.110.890.690.890.811.191.811.811.811.691.892.112.191.51.391.691.111.191.51.611.61
Wind gust (m/s)222.112.192.172.082.172.643.54.815.035.195.365.725.895.895.585.395.314.063.392.642.612.61
Wind direction (°)E 89°E 84°ENE 77°ENE 78°ENE 58°NNE 31°N 359°NNW 340°NW 326°NW 316°NW 316°NW 314°NW 309°WNW 302°WNW 297°WNW 288°W 270°SW 233°SSW 201°S 169°SE 127°E 101°E 98°E 94°

Air humidity

Humidity
Time00:0001:0002:0003:0004:0005:0006:0007:0008:0009:0010:0011:0012:0013:0014:0015:0016:0017:0018:0019:0020:0021:0022:0023:00
Humidity (%)979898999998989591868076726968677281919596979796

Atmospheric pressure

Pressure
Time00:0001:0002:0003:0004:0005:0006:0007:0008:0009:0010:0011:0012:0013:0014:0015:0016:0017:0018:0019:0020:0021:0022:0023:00
Pressure (mm Hg)756756755755756757757758758758758758757757756755755755755756757758758757

Ultraviolet index

UV Index
Time00:0001:0002:0003:0004:0005:0006:0007:0008:0009:0010:0011:0012:0013:0014:0015:0016:0017:0018:0019:0020:0021:0022:0023:00
UV Index00000000.51.73.87.310.311.211.610.77.42.61.10.600000

Air quality & pollen

Air quality
Time00:0001:0002:0003:0004:0005:0006:0007:0008:0009:0010:0011:0012:0013:0014:0015:0016:0017:0018:0019:0020:0021:0022:0023:00
PM2.5 (µg/m³)1713.113.415.719.623.726.323.114.38.45.854.54.74.44.44.44.65.96.78.69.59.39.6
PM10 (µg/m³)17.313.413.716.119.924.32723.614.78.665.14.64.74.54.44.44.66.16.98.89.79.59.8
Ozone (O₃) (µg/m³)504843383021224272939894919294928575666055535559
NO₂ (µg/m³)14.112.712.813.415.217.617.713.472.10.70.81.10.90.811.82.94.15.67.28.287.1
SO₂ (µg/m³)1.11111110.90.70.60.50.40.30.30.30.30.30.30.30.40.60.70.70.6
CO (µg/m³)384366353345341340338334330321305284267254244243252269296347407431386305

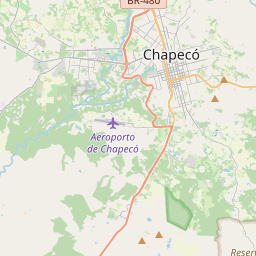
Chapecó on the map

Data Sources & Methodology

Our weather forecasts are powered by a professional weather data provider that aggregates data from national weather services, satellite observations, radar networks, and over 80,000 weather stations worldwide. Forecast data is updated multiple times daily. We convert raw data into clear summaries — wind speed in m/s, pressure in mmHg — so you can plan your day with confidence.