5-day weather forecast Chapecó Nov 18, 2026

25°19° · Fog

Weather forecast Chapecó tomorrow Nov 18, 2026: fog, temperature from 19 °C to 25 °C.

Precipitation probability 90%. Wind up to 2.31 m/s (gusts 8.5 m/s). Air humidity 80–98%, atmospheric pressure 754–757 mm Hg, UV index up to 12.7.

Sunrise 05:30
Sunset 19:00
Waxing Gibbous73% illuminated
Moonrise 13:27 · Moonset 01:32
Chart
Table

Forecast from 19 °C to 25 °C and precipitation

Temperature & Precipitation
Time00:0001:0002:0003:0004:0005:0006:0007:0008:0009:0010:0011:0012:0013:0014:0015:0016:0017:0018:0019:0020:0021:0022:0023:00
Temperature (°C)201919191919192021222324252524232222222120202019
Precipitation (mm/hr)0000000.010.190.380.570.390.280.411.281.639.664.970.050.020.020.020.030.030.04

Cloud cover and precipitation probability

Cloud cover & Rain chance
Time00:0001:0002:0003:0004:0005:0006:0007:0008:0009:0010:0011:0012:0013:0014:0015:0016:0017:0018:0019:0020:0021:0022:0023:00
Cloud cover (%)1001001001001001007685841001001001001001001009998989797969797
Rain chance (%)434342424242334759675748557072908633303133394143

Wind speed and direction

Wind & Wind gust
Time00:0001:0002:0003:0004:0005:0006:0007:0008:0009:0010:0011:0012:0013:0014:0015:0016:0017:0018:0019:0020:0021:0022:0023:00
Wind (m/s)1.51.611.611.51.611.812.111.190.810.811.311.891.891.39121.691.812.311.50.310.390.691
Wind gust (m/s)2.612.922.782.723.033.283.974.335.065.695.896.256.395.926.118.54.755.366.724.642.221.391.641.97
Wind direction (°)NE 53°NE 56°NE 53°NE 51°NE 44°NE 38°NE 36°NNE 27°N 357°NW 321°NNW 335°NNW 338°NNW 345°NW 319°WNW 300°WSW 258°NNW 347°N 353°N 357°NNW 346°NE 43°E 98°ESE 112°E 81°

Air humidity

Humidity
Time00:0001:0002:0003:0004:0005:0006:0007:0008:0009:0010:0011:0012:0013:0014:0015:0016:0017:0018:0019:0020:0021:0022:0023:00
Humidity (%)989898989797979693888480808282828587899193949596

Atmospheric pressure

Pressure
Time00:0001:0002:0003:0004:0005:0006:0007:0008:0009:0010:0011:0012:0013:0014:0015:0016:0017:0018:0019:0020:0021:0022:0023:00
Pressure (mm Hg)756755755755755755755756756757757756756755755755755754754755755756756756

Ultraviolet index

UV Index
Time00:0001:0002:0003:0004:0005:0006:0007:0008:0009:0010:0011:0012:0013:0014:0015:0016:0017:0018:0019:0020:0021:0022:0023:00
UV Index00000000.62.14.87.910.812.79.95.63.51.50.30.100000

Air quality & pollen

Air quality
Time00:0001:0002:0003:0004:0005:0006:0007:0008:0009:0010:0011:0012:0013:0014:0015:0016:0017:0018:0019:0020:0021:0022:0023:00
PM2.5 (µg/m³)14.618.122.127.732.229.924.116.711.18.16.254.34.84.44.54.85.18.415.32227.532.830.2
PM10 (µg/m³)1518.522.528.133.130.424.31711.48.36.35.14.34.84.44.64.85.18.515.722.427.933.330.5
Ozone (O₃) (µg/m³)494031252119233859768590939698969080705949424347
NO₂ (µg/m³)11.7162123.822.719.415.611.573.621.51.310.91.42.13.26.313.622.82825.519.1
SO₂ (µg/m³)11.31.71.81.510.60.50.50.50.50.40.40.40.30.30.30.30.511.72.11.91.5
CO (µg/m³)363397432442405342290262244233230233234228220220227241273342429481469423

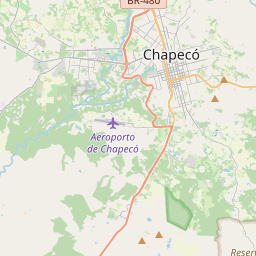
Chapecó on the map

Data Sources & Methodology

Our weather forecasts are powered by a professional weather data provider that aggregates data from national weather services, satellite observations, radar networks, and over 80,000 weather stations worldwide. Forecast data is updated multiple times daily. We convert raw data into clear summaries — wind speed in m/s, pressure in mmHg — so you can plan your day with confidence.