5-day weather forecast Cagliari Nov 14, 2026

21°14° · Patchy rain possible

Weather forecast Cagliari Saturday Nov 14, 2026: patchy rain possible, temperature from 14 °C to 21 °C.

Precipitation probability 25%. Wind up to 3.89 m/s (gusts 7.31 m/s). Air humidity 64–90%, atmospheric pressure 761–765 mm Hg, UV index up to 2.6.

Sunrise 07:05
Sunset 17:09
First Quarter31% illuminated
Moonrise 11:59 · Moonset 21:30
Chart
Table

Forecast from 14 °C to 21 °C and precipitation

Temperature & Precipitation
Time00:0001:0002:0003:0004:0005:0006:0007:0008:0009:0010:0011:0012:0013:0014:0015:0016:0017:0018:0019:0020:0021:0022:0023:00
Temperature (°C)171616151515141416171920202121212019181717171716
Precipitation (mm/hr)0.010.010.01000000000.020.040.070.050.030.020.010.0100000.01

Cloud cover and precipitation probability

Cloud cover & Rain chance
Time00:0001:0002:0003:0004:0005:0006:0007:0008:0009:0010:0011:0012:0013:0014:0015:0016:0017:0018:0019:0020:0021:0022:0023:00
Cloud cover (%)8189848766554585898278878158677281616074
Rain chance (%)2325241313131313119717181715161513172023192023

Wind speed and direction

Wind & Wind gust
Time00:0001:0002:0003:0004:0005:0006:0007:0008:0009:0010:0011:0012:0013:0014:0015:0016:0017:0018:0019:0020:0021:0022:0023:00
Wind (m/s)3.893.392.521.611.3110.690.50.390.190.310.691.311.311.111.1110.890.690.610.390.390.5
Wind gust (m/s)7.316.394.943.973.252.862.391.972.112.192.613.474.285.115.115.195.114.062.831.861.531.281.141.36
Wind direction (°)W 278°WNW 282°WNW 294°WNW 300°NW 305°NW 306°NW 315°NNW 331°NNW 345°N 2°NE 55°SE 133°S 173°S 185°S 190°SW 215°SW 222°SW 217°SW 220°SW 234°SW 229°SW 216°SSW 193°SSW 195°

Air humidity

Humidity
Time00:0001:0002:0003:0004:0005:0006:0007:0008:0009:0010:0011:0012:0013:0014:0015:0016:0017:0018:0019:0020:0021:0022:0023:00
Humidity (%)838486878889899085797470666464656774808486878888

Atmospheric pressure

Pressure
Time00:0001:0002:0003:0004:0005:0006:0007:0008:0009:0010:0011:0012:0013:0014:0015:0016:0017:0018:0019:0020:0021:0022:0023:00
Pressure (mm Hg)761761761761761762762763764764764764764764764764764764764764765765765765

Ultraviolet index

UV Index
Time00:0001:0002:0003:0004:0005:0006:0007:0008:0009:0010:0011:0012:0013:0014:0015:0016:0017:0018:0019:0020:0021:0022:0023:00
UV Index000000000.10.61.32.12.62.41.91.10.40000000

Air quality & pollen

Air quality
Time00:0001:0002:0003:0004:0005:0006:0007:0008:0009:0010:0011:0012:0013:0014:0015:0016:0017:0018:0019:0020:0021:0022:0023:00
PM2.5 (µg/m³)5.24.54.13.93.83.744.14.243.63.93.73.63.12.82.83.13.14.36.26.46.37.1
PM10 (µg/m³)11.210.48.88.38.17.88.38.58.89.39.67.87.88.17.36.25.65.85.36.68.49.19.412.3
Ozone (O₃) (µg/m³)545352525150504541525457626773716969695956535254
NO₂ (µg/m³)5.35.453.43.14.168.29.78.86.85.35.65.43.83.23.94.86.88.310.611.8108.8
SO₂ (µg/m³)0.50.50.50.40.50.50.50.50.70.70.91.22.73.11.40.80.60.30.40.61.11.11.11.4
CO (µg/m³)138136138139141142145146150151145142141139133136136136146156166155154167.5

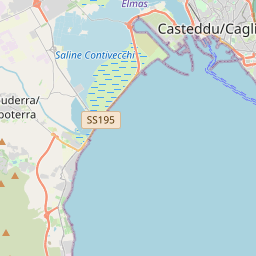
Cagliari on the map

Data Sources & Methodology

Our weather forecasts are powered by a professional weather data provider that aggregates data from national weather services, satellite observations, radar networks, and over 80,000 weather stations worldwide. Forecast data is updated multiple times daily. We convert raw data into clear summaries — wind speed in m/s, pressure in mmHg — so you can plan your day with confidence.