5-day weather forecast Bled Nov 15, 2026

5°-2° · Patchy rain possible

Weather forecast Bled tomorrow Nov 15, 2026: patchy rain possible, temperature from -2 °C to 5 °C.

Precipitation probability 36%. Wind up to 0.69 m/s (gusts 2.61 m/s). Air humidity 72–90%, atmospheric pressure 763–770 mm Hg, UV index up to 1.2.

5 days at a glance — tap a day to open it
Sunrise 07:05
Sunset 16:31
First Quarter42% illuminated
Moonrise 12:32 · Moonset 21:51
Chart
Table

Forecast from -2 °C to 5 °C and precipitation

Temperature & Precipitation
Time00:0001:0002:0003:0004:0005:0006:0007:0008:0009:0010:0011:0012:0013:0014:0015:0016:0017:0018:0019:0020:0021:0022:0023:00
Temperature (°C)-1-1-1-1-2-2-1-11245555555544333
Precipitation (mm/hr)0000000.010.010.010000.010.020.010.020.020.020.0100000.07

Cloud cover and precipitation probability

Cloud cover & Rain chance
Time00:0001:0002:0003:0004:0005:0006:0007:0008:0009:0010:0011:0012:0013:0014:0015:0016:0017:0018:0019:0020:0021:0022:0023:00
Cloud cover (%)707176808489949999939698989796959488827683909798
Rain chance (%)212123242527283027222020222324252725242325272936

Wind speed and direction

Wind & Wind gust
Time00:0001:0002:0003:0004:0005:0006:0007:0008:0009:0010:0011:0012:0013:0014:0015:0016:0017:0018:0019:0020:0021:0022:0023:00
Wind (m/s)0.190.190.190.110.310.310.310.50.310.310.310.190.110.310.390.310.390.390.190.110.310.390.50.69
Wind gust (m/s)1.191.111.111.111.281.311.361.561.6722.312.582.422.612.442.192.0321.781.531.611.751.922.28
Wind direction (°)S 180°SW 236°W 277°W 273°SW 231°WSW 241°W 261°SW 233°WSW 245°W 272°WNW 294°WNW 301°SSW 193°SSE 165°S 185°SSW 201°S 178°S 176°S 183°WNW 302°WNW 301°W 280°W 265°W 261°

Air humidity

Humidity
Time00:0001:0002:0003:0004:0005:0006:0007:0008:0009:0010:0011:0012:0013:0014:0015:0016:0017:0018:0019:0020:0021:0022:0023:00
Humidity (%)868687878888888884797372757679818384858788899090

Atmospheric pressure

Pressure
Time00:0001:0002:0003:0004:0005:0006:0007:0008:0009:0010:0011:0012:0013:0014:0015:0016:0017:0018:0019:0020:0021:0022:0023:00
Pressure (mm Hg)770770769769768768768768767767767767766765765765764764764764764764764763

Ultraviolet index

UV Index
Time00:0001:0002:0003:0004:0005:0006:0007:0008:0009:0010:0011:0012:0013:0014:0015:0016:0017:0018:0019:0020:0021:0022:0023:00
UV Index0000000000.40.81.11.20.30.10.100000000

Air quality & pollen

Air quality
Time00:0001:0002:0003:0004:0005:0006:0007:0008:0009:0010:0011:0012:0013:0014:0015:0016:0017:0018:0019:0020:0021:0022:0023:00
PM2.5 (µg/m³)21.117.913.912.310.910.811.612.3128.97.766.45.855.75.710.510.515.515.416.217.918.3
PM10 (µg/m³)25.622.317.819.317.114.313.61514.212.210.89.29.89.17.28.37.711.512.717.717.918.219.619.9
Ozone (O₃) (µg/m³)495251535453525354646767676471686961555452545546.3
NO₂ (µg/m³)7.16.55.44.33.73.33.13.55.35.73.643.32.72.22.94.15.35.566.36.25.910.2
SO₂ (µg/m³)0.70.60.50.60.60.50.60.70.80.90.910.90.70.60.50.50.50.60.60.60.50.40.7
CO (µg/m³)226222218211201191183183179167159156156149147156167182186201221222220230.8

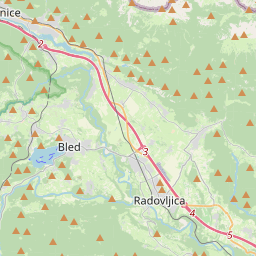
Bled on the map

Data Sources & Methodology

Our weather forecasts are powered by a professional weather data provider that aggregates data from national weather services, satellite observations, radar networks, and over 80,000 weather stations worldwide. Forecast data is updated multiple times daily. We convert raw data into clear summaries — wind speed in m/s, pressure in mmHg — so you can plan your day with confidence.