5-day weather forecast Willmar Nov 20, 2026

16°5° · Overcast

Weather forecast Willmar Friday Nov 20, 2026: overcast, temperature from 5 °C to 16 °C.

Precipitation probability 28%. Wind up to 7.69 m/s (gusts 15.47 m/s). Air humidity 67–89%, atmospheric pressure 753–766 mm Hg, UV index up to 1.1.

5 days at a glance — tap a day to open it
Sunrise 07:24
Sunset 16:46
Waxing Gibbous89% illuminated
Moonrise 14:23 · Moonset 02:50
Chart
Table

Forecast from 5 °C to 16 °C and precipitation

Temperature & Precipitation
Time00:0001:0002:0003:0004:0005:0006:0007:0008:0009:0010:0011:0012:0013:0014:0015:0016:0017:0018:0019:0020:0021:0022:0023:00
Temperature (°C)555666789101113141515161515151515151514
Precipitation (mm/hr)00000000000000000.030.050.080.060.03000.01

Cloud cover and precipitation probability

Cloud cover & Rain chance
Time00:0001:0002:0003:0004:0005:0006:0007:0008:0009:0010:0011:0012:0013:0014:0015:0016:0017:0018:0019:0020:0021:0022:0023:00
Cloud cover (%)9395979997998996969496981001001001001001001007668587975
Rain chance (%)222220202225252828282522201818172123262016131718

Wind speed and direction

Wind & Wind gust
Time00:0001:0002:0003:0004:0005:0006:0007:0008:0009:0010:0011:0012:0013:0014:0015:0016:0017:0018:0019:0020:0021:0022:0023:00
Wind (m/s)2.893.54.114.614.694.895.115.696.316.897.197.57.697.397.397.197.117.317.57.317.397.57.316.89
Wind gust (m/s)5.086.928.118.899.089.7510.5811.6112.5813.3914.0314.6415.4715.1414.751413.3913.4713.4713.4413.5313.6113.4213
Wind direction (°)ESE 114°ESE 115°ESE 117°ESE 118°ESE 123°SE 129°SE 137°SE 145°SSE 150°SSE 155°SSE 159°SSE 164°SSE 168°S 172°S 173°S 177°S 183°S 184°S 187°S 191°SSW 192°SSW 193°SSW 197°SSW 202°

Air humidity

Humidity
Time00:0001:0002:0003:0004:0005:0006:0007:0008:0009:0010:0011:0012:0013:0014:0015:0016:0017:0018:0019:0020:0021:0022:0023:00
Humidity (%)797774737782868889898478737068677071727373747677

Atmospheric pressure

Pressure
Time00:0001:0002:0003:0004:0005:0006:0007:0008:0009:0010:0011:0012:0013:0014:0015:0016:0017:0018:0019:0020:0021:0022:0023:00
Pressure (mm Hg)766766765764764763762761761760759758757756755754754753753753753753753753

Ultraviolet index

UV Index
Time00:0001:0002:0003:0004:0005:0006:0007:0008:0009:0010:0011:0012:0013:0014:0015:0016:0017:0018:0019:0020:0021:0022:0023:00
UV Index0000000000.20.60.91.110.80.300000000

Air quality & pollen

Air quality
Time00:0001:0002:0003:0004:0005:0006:0007:0008:0009:0010:0011:0012:0013:0014:0015:0016:0017:0018:0019:0020:0021:0022:0023:00
PM2.5 (µg/m³)2.32.12.74.15.46.98.49.39.58.15.64.84.75.14.95.15.27.95.85.85.85.24.74.6
PM10 (µg/m³)2.32.22.94.55.97.38.69.59.88.66.45.45.45.95.766.19.16.76.66.75.95.14.8
Ozone (O₃) (µg/m³)313130303031343946525659636873767776757473727068
NO₂ (µg/m³)5.86.48.510.110.610.6108.56.44.743.73.53.12.72.52.52.62.72.72.72.62.52.5
SO₂ (µg/m³)0.60.60.60.60.60.60.70.811.11.11.11.110.90.80.80.911.11.11.110.9
CO (µg/m³)170159155154160169176177175171165157151148148147146145145145145145144143

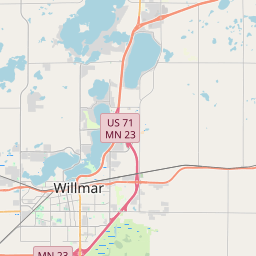
Willmar on the map

Data Sources & Methodology

Our weather forecasts are powered by a professional weather data provider that aggregates data from national weather services, satellite observations, radar networks, and over 80,000 weather stations worldwide. Forecast data is updated multiple times daily. We convert raw data into clear summaries — wind speed in m/s, pressure in mmHg — so you can plan your day with confidence.