5-day weather forecast Vigo Nov 6, 2026

15°7° · Overcast

Weather forecast Vigo tomorrow Nov 6, 2026: overcast, temperature from 7 °C to 15 °C.

Precipitation probability 60%. Wind up to 2.69 m/s (gusts 7.19 m/s). Air humidity 37–88%, atmospheric pressure 765–767 mm Hg, UV index up to 2.2.

5 days at a glance — tap a day to open it
Sunrise 08:14
Sunset 18:22
Waning Crescent6% illuminated
Moonrise 05:03 · Moonset 16:38
Chart
Table

Forecast from 7 °C to 15 °C and precipitation

Temperature & Precipitation
Time00:0001:0002:0003:0004:0005:0006:0007:0008:0009:0010:0011:0012:0013:0014:0015:0016:0017:0018:0019:0020:0021:0022:0023:00
Temperature (°C)9899789789912131515151414131212121212
Precipitation (mm/hr)00000000000000000.29000.610.080.060.140.03

Cloud cover and precipitation probability

Cloud cover & Rain chance
Time00:0001:0002:0003:0004:0005:0006:0007:0008:0009:0010:0011:0012:0013:0014:0015:0016:0017:0018:0019:0020:0021:0022:0023:00
Cloud cover (%)9289868992100100991001009610010098100100100100100100100100100100
Rain chance (%)182616172720192717162012111110103712136020193618

Wind speed and direction

Wind & Wind gust
Time00:0001:0002:0003:0004:0005:0006:0007:0008:0009:0010:0011:0012:0013:0014:0015:0016:0017:0018:0019:0020:0021:0022:0023:00
Wind (m/s)2.191.812.312.3922.52.612.112.692.612.1921.51.50.1110.891.892.191.3110.3121.61
Wind gust (m/s)7.192.616.316.393.255.52.613.336.692.613.922.191.833.671.221.314.316.892.313.751.110.724.311.92
Wind direction (°)ESE 102°ESE 106°E 101°ESE 104°ESE 117°ESE 116°ESE 107°ESE 112°ESE 113°ESE 115°ESE 112°ESE 116°ESE 110°SSE 148°ENE 76°WNW 291°S 169°WNW 299°NW 319°E 94°NNE 12°E 84°ESE 105°E 95°

Air humidity

Humidity
Time00:0001:0002:0003:0004:0005:0006:0007:0008:0009:0010:0011:0012:0013:0014:0015:0016:0017:0018:0019:0020:0021:0022:0023:00
Humidity (%)718771718872708667647549454737396049537658608062

Atmospheric pressure

Pressure
Time00:0001:0002:0003:0004:0005:0006:0007:0008:0009:0010:0011:0012:0013:0014:0015:0016:0017:0018:0019:0020:0021:0022:0023:00
Pressure (mm Hg)766766766766765766766766766767766767767766766766765766766765767767765767

Ultraviolet index

UV Index
Time00:0001:0002:0003:0004:0005:0006:0007:0008:0009:0010:0011:0012:0013:0014:0015:0016:0017:0018:0019:0020:0021:0022:0023:00
UV Index00000000000.40.91.72.220.90.60.3000000

Air quality & pollen

Air quality
Time00:0001:0002:0003:0004:0005:0006:0007:0008:0009:0010:0011:0012:0013:0014:0015:0016:0017:0018:0019:0020:0021:0022:0023:00
PM2.5 (µg/m³)2927.226.224.223.823.922.721.519.717.616.415.21514.413.19.79.78.410.2108.77.47.57.4
PM10 (µg/m³)31.330.328.726.626.825.624.322.820.919.117.716.916.916.914.513.211.810.410.511.113.312.610.28.2
Ozone (O₃) (µg/m³)353536363637373732333239495767676967625352495253
NO₂ (µg/m³)28.725.222.12017.915.513.812.91718.616.912.911.69.59.310.410.111.715.71614.814.413.812.6
SO₂ (µg/m³)2.62.11.91.71.51.41.51.82.22.32.32.11.9221.61.61.61.61.71.51.31.11.1
CO (µg/m³)240238228218208206206205202199195190187178172164159160163174171164163160

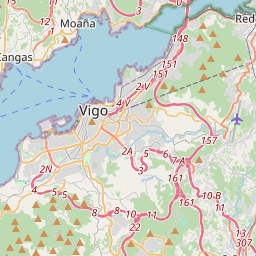
Vigo on the map

Data Sources & Methodology

Our weather forecasts are powered by a professional weather data provider that aggregates data from national weather services, satellite observations, radar networks, and over 80,000 weather stations worldwide. Forecast data is updated multiple times daily. We convert raw data into clear summaries — wind speed in m/s, pressure in mmHg — so you can plan your day with confidence.