5-day weather forecast Pretoria Nov 18, 2026

26°15° · Patchy rain possible

Weather forecast Pretoria tomorrow Nov 18, 2026: patchy rain possible, temperature from 15 °C to 26 °C.

Precipitation probability 19%. Wind up to 4.39 m/s (gusts 8.17 m/s). Air humidity 45–84%, atmospheric pressure 761–767 mm Hg, UV index up to 14.3.

Sunrise 05:09
Sunset 18:35
Waxing Gibbous73% illuminated
Moonrise 12:53 · Moonset 01:02
Chart
Table

Forecast from 15 °C to 26 °C and precipitation

Temperature & Precipitation
Time00:0001:0002:0003:0004:0005:0006:0007:0008:0009:0010:0011:0012:0013:0014:0015:0016:0017:0018:0019:0020:0021:0022:0023:00
Temperature (°C)181716161515151618192022232525262525242221212019
Precipitation (mm/hr)00000000.010.010.030.060.080.060.050.040.060.090.110.070.040000

Cloud cover and precipitation probability

Cloud cover & Rain chance
Time00:0001:0002:0003:0004:0005:0006:0007:0008:0009:0010:0011:0012:0013:0014:0015:0016:0017:0018:0019:0020:0021:0022:0023:00
Cloud cover (%)456223955585976919185778987929663696066573343
Rain chance (%)9991114171715161919181717111717171710111089

Wind speed and direction

Wind & Wind gust
Time00:0001:0002:0003:0004:0005:0006:0007:0008:0009:0010:0011:0012:0013:0014:0015:0016:0017:0018:0019:0020:0021:0022:0023:00
Wind (m/s)444.1943.893.6944.194.394.1943.893.693.53.192.892.691.891.191.892.392.1932.5
Wind gust (m/s)7.397.537.947.867.757.57.897.928.177.897.727.697.176.786.336.476.285.894.584.334.864.645.335.31
Wind direction (°)NE 40°NE 38°NE 38°NE 36°NE 38°NE 38°NE 35°NNE 29°NNE 22°N 10°N 0°N 350°NNW 342°NNW 329°NW 314°WNW 301°WNW 294°WNW 301°NNW 343°NE 38°NE 44°NE 39°NNE 30°NNE 21°

Air humidity

Humidity
Time00:0001:0002:0003:0004:0005:0006:0007:0008:0009:0010:0011:0012:0013:0014:0015:0016:0017:0018:0019:0020:0021:0022:0023:00
Humidity (%)787980818284837874696560555047464545515966686869

Atmospheric pressure

Pressure
Time00:0001:0002:0003:0004:0005:0006:0007:0008:0009:0010:0011:0012:0013:0014:0015:0016:0017:0018:0019:0020:0021:0022:0023:00
Pressure (mm Hg)764764764764765766766767767767766765764764763762761761761762762763763763

Ultraviolet index

UV Index
Time00:0001:0002:0003:0004:0005:0006:0007:0008:0009:0010:0011:0012:0013:0014:0015:0016:0017:0018:0019:0020:0021:0022:0023:00
UV Index0000000.2136.19.412.414.313.610.95.91.51.10.300000

Air quality & pollen

Air quality
Time00:0001:0002:0003:0004:0005:0006:0007:0008:0009:0010:0011:0012:0013:0014:0015:0016:0017:0018:0019:0020:0021:0022:0023:00
PM2.5 (µg/m³)9.58.37.16.15.65.45.35.96.56.76.46.56.56.98.16.86.56.471423.522.51814
PM10 (µg/m³)108.87.76.66.166.16.97.77.97.27.37.37.79.17.57.27.27.915.124.923.819.214.9
Ozone (O₃) (µg/m³)61605855525153576268768389959810010095816249464952
NO₂ (µg/m³)8.96.75.24.74.954.64.13.632.41.91.61.41.40.90.62.79.919.425.223.718.513.8
SO₂ (µg/m³)11.59.37.7777.17.37.67.67.26.55.95.55.35.14.23.55.413.123.529.727.921.916.4
CO (µg/m³)17614011410410310510911712413113714314715115514012517032654172788410111011

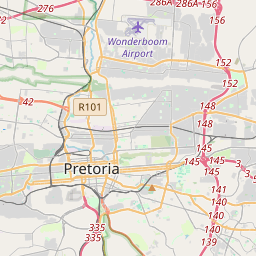
Pretoria on the map

Data Sources & Methodology

Our weather forecasts are powered by a professional weather data provider that aggregates data from national weather services, satellite observations, radar networks, and over 80,000 weather stations worldwide. Forecast data is updated multiple times daily. We convert raw data into clear summaries — wind speed in m/s, pressure in mmHg — so you can plan your day with confidence.