5-day weather forecast Perth Nov 19, 2026

23°16° · Partly cloudy

Weather forecast Perth Thursday Nov 19, 2026: partly cloudy, temperature from 16 °C to 23 °C.

Precipitation probability 19%. Wind up to 4.39 m/s (gusts 7.92 m/s). Air humidity 52–90%, atmospheric pressure 758–760 mm Hg, UV index up to 11.4.

Sunrise 05:06
Sunset 18:57
Waxing Gibbous81% illuminated
Moonrise 13:40 · Moonset 01:36
Chart
Table

Forecast from 16 °C to 23 °C and precipitation

Temperature & Precipitation
Time00:0001:0002:0003:0004:0005:0006:0007:0008:0009:0010:0011:0012:0013:0014:0015:0016:0017:0018:0019:0020:0021:0022:0023:00
Temperature (°C)171717161616171820212223232323232221201919181817
Precipitation (mm/hr)00000000.010.010.0100000000000000

Cloud cover and precipitation probability

Cloud cover & Rain chance
Time00:0001:0002:0003:0004:0005:0006:0007:0008:0009:0010:0011:0012:0013:0014:0015:0016:0017:0018:0019:0020:0021:0022:0023:00
Cloud cover (%)29241726323734777086212024293428324938331211108
Rain chance (%)141413141617151915155344445889991011

Wind speed and direction

Wind & Wind gust
Time00:0001:0002:0003:0004:0005:0006:0007:0008:0009:0010:0011:0012:0013:0014:0015:0016:0017:0018:0019:0020:0021:0022:0023:00
Wind (m/s)0.810.50.190.110.190.110.6111.612.312.893.613.894.194.394.394.314.193.52.892.311.891.891.61
Wind gust (m/s)1.921.641.421.391.611.692.393.033.724.645.446.366.897.397.837.927.897.836.645.584.563.833.583
Wind direction (°)SSW 197°SSW 201°SSW 210°WSW 252°WNW 297°NNE 32°NW 325°WNW 302°WNW 296°WNW 283°W 276°W 272°W 272°W 272°W 269°W 267°W 267°W 266°W 266°W 266°W 269°W 271°W 271°W 274°

Air humidity

Humidity
Time00:0001:0002:0003:0004:0005:0006:0007:0008:0009:0010:0011:0012:0013:0014:0015:0016:0017:0018:0019:0020:0021:0022:0023:00
Humidity (%)868686878890857972666054535252555963677277798183

Atmospheric pressure

Pressure
Time00:0001:0002:0003:0004:0005:0006:0007:0008:0009:0010:0011:0012:0013:0014:0015:0016:0017:0018:0019:0020:0021:0022:0023:00
Pressure (mm Hg)759758758758758758759759760760759759759758758758758758759759759759759759

Ultraviolet index

UV Index
Time00:0001:0002:0003:0004:0005:0006:0007:0008:0009:0010:0011:0012:0013:0014:0015:0016:0017:0018:0019:0020:0021:0022:0023:00
UV Index0000000.20.82.557.910.311.411.29.46.63.81.60.400000

Air quality & pollen

Air quality
Time00:0001:0002:0003:0004:0005:0006:0007:0008:0009:0010:0011:0012:0013:0014:0015:0016:0017:0018:0019:0020:0021:0022:0023:00
PM2.5 (µg/m³)7.78.49.19.39.39.611.915.37.87.67.77.788.38.68.98.88.78.68.98.49.51112
PM10 (µg/m³)9.610.511.311.811.812.214.617.81110.710.910.911.411.812.312.812.612.512.613.111.813.215.416.9
Ozone (O₃) (µg/m³)323028262425303846556470737371676256494033282421
NO₂ (µg/m³)16.417.518.419.420.219.415.910.96.84.5321.41.41.51.61.92.957.810.713.716.818.8
SO₂ (µg/m³)3.33.43.53.73.94.14.44.74.74.13.12.42.11.91.91.922.12.32.733.43.84.1
CO (µg/m³)1641771821721541371271181101009082787777777881848998116137149

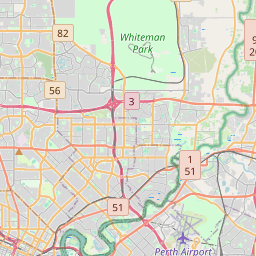
Perth on the map

Data Sources & Methodology

Our weather forecasts are powered by a professional weather data provider that aggregates data from national weather services, satellite observations, radar networks, and over 80,000 weather stations worldwide. Forecast data is updated multiple times daily. We convert raw data into clear summaries — wind speed in m/s, pressure in mmHg — so you can plan your day with confidence.