5-day weather forecast Newman Nov 14, 2026

37°24° · Partly cloudy

Weather forecast Newman Saturday Nov 14, 2026: partly cloudy, temperature from 24 °C to 37 °C.

Precipitation probability 4%. Wind up to 5.31 m/s (gusts 8.69 m/s). Air humidity 14–29%, atmospheric pressure 757–761 mm Hg, UV index up to 13.4.

Sunrise 05:08
Sunset 18:22
First Quarter31% illuminated
Moonrise 09:04 · Moonset 23:01
Chart
Table

Forecast from 24 °C to 37 °C and precipitation

Temperature & Precipitation
Time00:0001:0002:0003:0004:0005:0006:0007:0008:0009:0010:0011:0012:0013:0014:0015:0016:0017:0018:0019:0020:0021:0022:0023:00
Temperature (°C)292827262524262830323435363737373636353332313029
Precipitation (mm/hr)000000000000000000000000

Cloud cover and precipitation probability

Cloud cover & Rain chance
Time00:0001:0002:0003:0004:0005:0006:0007:0008:0009:0010:0011:0012:0013:0014:0015:0016:0017:0018:0019:0020:0021:0022:0023:00
Cloud cover (%)4934843361013950161335495053514136355140
Rain chance (%)321111111100112334332233

Wind speed and direction

Wind & Wind gust
Time00:0001:0002:0003:0004:0005:0006:0007:0008:0009:0010:0011:0012:0013:0014:0015:0016:0017:0018:0019:0020:0021:0022:0023:00
Wind (m/s)2.613.113.313.53.693.894.1955.314.613.893.113.393.6943.894.194.693.813.613.192.692.612.81
Wind gust (m/s)5.396.476.586.086.226.57.868.038.367.676.836.867.317.838.698.588.568.337.537.56.815.815.177
Wind direction (°)WNW 293°WSW 249°WSW 238°WSW 241°WSW 240°SW 234°SW 223°SW 221°SW 220°SW 224°SW 232°WSW 247°W 266°W 273°W 272°W 272°WNW 282°WNW 286°W 277°W 260°WSW 253°W 266°W 281°WSW 251°

Air humidity

Humidity
Time00:0001:0002:0003:0004:0005:0006:0007:0008:0009:0010:0011:0012:0013:0014:0015:0016:0017:0018:0019:0020:0021:0022:0023:00
Humidity (%)282626272829252117161616151514141415161820212324

Atmospheric pressure

Pressure
Time00:0001:0002:0003:0004:0005:0006:0007:0008:0009:0010:0011:0012:0013:0014:0015:0016:0017:0018:0019:0020:0021:0022:0023:00
Pressure (mm Hg)760760759759760760761761761761760759759758757757757757757758758758758758

Ultraviolet index

UV Index
Time00:0001:0002:0003:0004:0005:0006:0007:0008:0009:0010:0011:0012:0013:0014:0015:0016:0017:0018:0019:0020:0021:0022:0023:00
UV Index0000000.213.16.29.712.413.412.49.86.33.21.10.200000

Air quality & pollen

Air quality
Time00:0001:0002:0003:0004:0005:0006:0007:0008:0009:0010:0011:0012:0013:0014:0015:0016:0017:0018:0019:0020:0021:0022:0023:00
PM2.5 (µg/m³)3.23.43.42.92.31.71.41.41.82.12.84.14.44.243.83.73.83.73.63.63.63.73.7
PM10 (µg/m³)3.63.83.83.42.82.21.91.92.42.73.24.44.74.64.44.24.34.54.54.34.34.34.34.3
Ozone (O₃) (µg/m³)484441404041444854627278797876767775696053484443
NO₂ (µg/m³)1.11.110.90.70.60.50.40.30.20.10.10.10.10.10.10.10.10.20.40.50.60.70.7
SO₂ (µg/m³)0.30.30.30.30.30.30.30.30.30.40.40.50.50.40.40.40.30.30.30.20.20.20.20.2
CO (µg/m³)13113613813813613111810194104124141152160165167166165165165164162158154

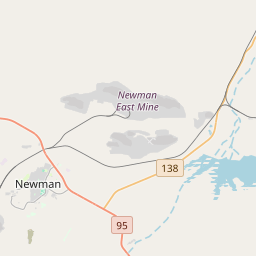
Newman on the map

Data Sources & Methodology

Our weather forecasts are powered by a professional weather data provider that aggregates data from national weather services, satellite observations, radar networks, and over 80,000 weather stations worldwide. Forecast data is updated multiple times daily. We convert raw data into clear summaries — wind speed in m/s, pressure in mmHg — so you can plan your day with confidence.