5-day weather forecast Melbourne Nov 19, 2026

28°12° · Overcast

Weather forecast Melbourne Thursday Nov 19, 2026: overcast, temperature from 12 °C to 28 °C.

Precipitation probability 48%. Wind up to 1.81 m/s (gusts 5.89 m/s). Air humidity 42–94%, atmospheric pressure 761–767 mm Hg, UV index up to 8.3.

Sunrise 05:56
Sunset 20:14
Waxing Gibbous81% illuminated
Moonrise 14:38 · Moonset 02:40
Chart
Table

Forecast from 12 °C to 28 °C and precipitation

Temperature & Precipitation
Time00:0001:0002:0003:0004:0005:0006:0007:0008:0009:0010:0011:0012:0013:0014:0015:0016:0017:0018:0019:0020:0021:0022:0023:00
Temperature (°C)131312121212121315172022252628272625232120191918
Precipitation (mm/hr)0000000000000000000.040.210.010.190.140.05

Cloud cover and precipitation probability

Cloud cover & Rain chance
Time00:0001:0002:0003:0004:0005:0006:0007:0008:0009:0010:0011:0012:0013:0014:0015:0016:0017:0018:0019:0020:0021:0022:0023:00
Cloud cover (%)626067528783969492989998999999100100100100100100100100100
Rain chance (%)222224212928302723201614121110111213204226484236

Wind speed and direction

Wind & Wind gust
Time00:0001:0002:0003:0004:0005:0006:0007:0008:0009:0010:0011:0012:0013:0014:0015:0016:0017:0018:0019:0020:0021:0022:0023:00
Wind (m/s)1.611.311.3910.690.610.690.390.110.310.390.310.310.610.810.691.51.310.311.191.610.691.111.81
Wind gust (m/s)3.813.142.942.281.751.51.921.781.612.142.833.614.615.225.895.445.394.785.065.085.784.364.364.69
Wind direction (°)W 268°WNW 287°NW 312°NW 319°NNW 328°NNW 341°NNE 12°N 5°NE 47°E 95°ESE 106°ESE 114°N 2°NNW 332°WNW 290°WSW 245°SSW 207°SSW 203°NNW 334°WNW 298°WNW 293°NNW 337°NE 49°NNE 30°

Air humidity

Humidity
Time00:0001:0002:0003:0004:0005:0006:0007:0008:0009:0010:0011:0012:0013:0014:0015:0016:0017:0018:0019:0020:0021:0022:0023:00
Humidity (%)919394939393928881736660524742455155677682869092

Atmospheric pressure

Pressure
Time00:0001:0002:0003:0004:0005:0006:0007:0008:0009:0010:0011:0012:0013:0014:0015:0016:0017:0018:0019:0020:0021:0022:0023:00
Pressure (mm Hg)767766766765765764764764764764764764763762761761761761761761761761761761

Ultraviolet index

UV Index
Time00:0001:0002:0003:0004:0005:0006:0007:0008:0009:0010:0011:0012:0013:0014:0015:0016:0017:0018:0019:0020:0021:0022:0023:00
UV Index00000000.20.92.24.16.37.27.68.37.64.92.30.60.20000

Air quality & pollen

Air quality
Time00:0001:0002:0003:0004:0005:0006:0007:0008:0009:0010:0011:0012:0013:0014:0015:0016:0017:0018:0019:0020:0021:0022:0023:00
PM2.5 (µg/m³)98.68.188.28.48.89.510.411.412.814.315.416.21616.316.419.52121.222.122.821.418.6
PM10 (µg/m³)12.311.710.910.610.911.411.712.413.314.515.917.719.1202020.220.123.124.32425.325.423.420.1
Ozone (O₃) (µg/m³)312927252424242627282832425563625549433833302726
NO₂ (µg/m³)12.412.71313.513.914.21413.713.81516.717.817.316.316.920.62631.135.940.442.741.437.934.3
SO₂ (µg/m³)2.62.62.72.93.13.54.1567.59.110.210.39.99.48.77.97.47.588.17.66.86
CO (µg/m³)111111109104979498106116128142152155154154154155164184212240273307324

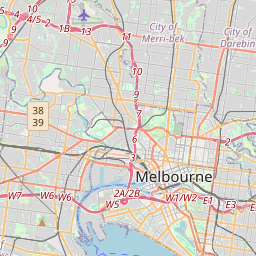
Melbourne on the map

Data Sources & Methodology

Our weather forecasts are powered by a professional weather data provider that aggregates data from national weather services, satellite observations, radar networks, and over 80,000 weather stations worldwide. Forecast data is updated multiple times daily. We convert raw data into clear summaries — wind speed in m/s, pressure in mmHg — so you can plan your day with confidence.