5-day weather forecast Las Vegas Nov 5, 2026

20°10° · Sunny

Weather forecast Las Vegas Thursday Nov 5, 2026: sunny, temperature from 10 °C to 20 °C.

Precipitation probability 9%. Wind up to 4.11 m/s (gusts 8.31 m/s). Air humidity 30–57%, atmospheric pressure 761–764 mm Hg, UV index up to 4.1.

Sunrise 06:07
Sunset 16:40
Waning Crescent13% illuminated
Moonrise 02:17 · Moonset 14:30
Chart
Table

Forecast from 10 °C to 20 °C and precipitation

Temperature & Precipitation
Time00:0001:0002:0003:0004:0005:0006:0007:0008:0009:0010:0011:0012:0013:0014:0015:0016:0017:0018:0019:0020:0021:0022:0023:00
Temperature (°C)131212111011101115161718191920201817161315141314
Precipitation (mm/hr)000000000000000000000000

Cloud cover and precipitation probability

Cloud cover & Rain chance
Time00:0001:0002:0003:0004:0005:0006:0007:0008:0009:0010:0011:0012:0013:0014:0015:0016:0017:0018:0019:0020:0021:0022:0023:00
Cloud cover (%)90255321360434862725761001004480233210500
Rain chance (%)931253764121169947251121

Wind speed and direction

Wind & Wind gust
Time00:0001:0002:0003:0004:0005:0006:0007:0008:0009:0010:0011:0012:0013:0014:0015:0016:0017:0018:0019:0020:0021:0022:0023:00
Wind (m/s)1.891.391.51.110.810.190.390.610.50.1910.811.311.891.8121.191.8910.892.113.312.814.11
Wind gust (m/s)1.922.751.641.222.080.420.52.190.51.53.642.222.834.812.6923.391.8911.972.118.314.424.5
Wind direction (°)NNW 336°NNW 332°NNW 336°NNW 334°NNW 327°E 100°SSE 160°NW 304°S 180°W 274°N 6°NNE 12°NNE 27°NNE 20°E 79°E 94°ENE 70°ESE 107°E 91°NW 307°NW 310°NW 313°NW 318°NW 317°

Air humidity

Humidity
Time00:0001:0002:0003:0004:0005:0006:0007:0008:0009:0010:0011:0012:0013:0014:0015:0016:0017:0018:0019:0020:0021:0022:0023:00
Humidity (%)395444465751535746424235323630314540425542404840

Atmospheric pressure

Pressure
Time00:0001:0002:0003:0004:0005:0006:0007:0008:0009:0010:0011:0012:0013:0014:0015:0016:0017:0018:0019:0020:0021:0022:0023:00
Pressure (mm Hg)761762761761762762762764764764764763762762761761762762763763763764764764

Ultraviolet index

UV Index
Time00:0001:0002:0003:0004:0005:0006:0007:0008:0009:0010:0011:0012:0013:0014:0015:0016:0017:0018:0019:0020:0021:0022:0023:00
UV Index00000000.10.61.6344.13.42.20.90.20000000

Air quality & pollen

Air quality
Time00:0001:0002:0003:0004:0005:0006:0007:0008:0009:0010:0011:0012:0013:0014:0015:0016:0017:0018:0019:0020:0021:0022:0023:00
PM2.5 (µg/m³)16.614.612.410.38.67.47.59.19.15.842.92.72.72.62.73.25.98.811.513.815.416.315.8
PM10 (µg/m³)17.114.912.610.58.77.67.69.29.36.24.43.22.92.92.92.93.46.29.211.914.315.916.816.1
Ozone (O₃) (µg/m³)455664272754758589909190826338188421
NO₂ (µg/m³)46.640.536.132.328.926.123.620.716.511.98.15.63.93.121.86.320.138.752.456.956.554.250.1
SO₂ (µg/m³)0.70.50.40.30.20.20.20.30.40.50.60.60.50.40.40.40.40.50.80.9110.90.8
CO (µg/m³)272265232191173204259288265217176153138133134145177257358413378297232207

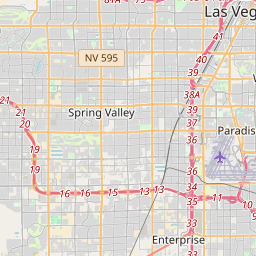
Las Vegas on the map

Data Sources & Methodology

Our weather forecasts are powered by a professional weather data provider that aggregates data from national weather services, satellite observations, radar networks, and over 80,000 weather stations worldwide. Forecast data is updated multiple times daily. We convert raw data into clear summaries — wind speed in m/s, pressure in mmHg — so you can plan your day with confidence.