5-day weather forecast Kilamba Nov 19, 2026

32°25° · Patchy rain possible

Weather forecast Kilamba tomorrow Nov 19, 2026: patchy rain possible, temperature from 25 °C to 32 °C.

Precipitation probability 26%. Wind up to 5.11 m/s (gusts 7.58 m/s). Air humidity 53–89%, atmospheric pressure 757–761 mm Hg, UV index up to 11.1.

Sunrise 05:36
Sunset 18:09
Waxing Gibbous81% illuminated
Moonrise 13:47 · Moonset 01:28
Chart
Table

Forecast from 25 °C to 32 °C and precipitation

Temperature & Precipitation
Time00:0001:0002:0003:0004:0005:0006:0007:0008:0009:0010:0011:0012:0013:0014:0015:0016:0017:0018:0019:0020:0021:0022:0023:00
Temperature (°C)252525252525252627293031323232313029282726262626
Precipitation (mm/hr)00.010.010.010.010.010.020.020000.030.060.080.050.0300000000

Cloud cover and precipitation probability

Cloud cover & Rain chance
Time00:0001:0002:0003:0004:0005:0006:0007:0008:0009:0010:0011:0012:0013:0014:0015:0016:0017:0018:0019:0020:0021:0022:0023:00
Cloud cover (%)31858774825775877574625652568770214253635211312
Rain chance (%)1425262426202323151188171717113581112111111

Wind speed and direction

Wind & Wind gust
Time00:0001:0002:0003:0004:0005:0006:0007:0008:0009:0010:0011:0012:0013:0014:0015:0016:0017:0018:0019:0020:0021:0022:0023:00
Wind (m/s)1.51.391.51.691.891.892.112.191.691.1910.61244.895.115.114.614.1943.613.112.612.19
Wind gust (m/s)2.892.723.283.864.284.114.033.753.533.393.334.115.176.617.117.587.477.226.976.696.035.284.443.64
Wind direction (°)S 187°SSE 165°SSE 166°SSE 165°SSE 165°SSE 155°SSE 157°SSE 154°SE 143°SE 128°E 98°NNW 335°WNW 296°WNW 282°W 269°W 259°WSW 258°WSW 248°WSW 237°SW 229°SW 227°SW 220°SSW 209°SSW 206°

Air humidity

Humidity
Time00:0001:0002:0003:0004:0005:0006:0007:0008:0009:0010:0011:0012:0013:0014:0015:0016:0017:0018:0019:0020:0021:0022:0023:00
Humidity (%)858788898988858173655855545356596066727880818284

Atmospheric pressure

Pressure
Time00:0001:0002:0003:0004:0005:0006:0007:0008:0009:0010:0011:0012:0013:0014:0015:0016:0017:0018:0019:0020:0021:0022:0023:00
Pressure (mm Hg)760760760759759760760761761761761760759758758757757757758758759760761760

Ultraviolet index

UV Index
Time00:0001:0002:0003:0004:0005:0006:0007:0008:0009:0010:0011:0012:0013:0014:0015:0016:0017:0018:0019:0020:0021:0022:0023:00
UV Index00000000.31.83.55.4910.211.18.95.92.80.9000000

Air quality & pollen

Air quality
Time00:0001:0002:0003:0004:0005:0006:0007:0008:0009:0010:0011:0012:0013:0014:0015:0016:0017:0018:0019:0020:0021:0022:0023:00
PM2.5 (µg/m³)9.69.49.39.38.88.69.39.11011.4121313.714.815.315.31412.712.11212.212.512.612.1
PM10 (µg/m³)14.213.713.413.312.812.513.213.21415.816.918.519.521.121.621.620.218.71818.118.518.81918
Ozone (O₃) (µg/m³)3838373636374046597691102109112108988671534137394040
NO₂ (µg/m³)4.44.23.93.63.43.53.83.93.63.12.72.42.122.12.22.63.244.64.84.84.74.6
SO₂ (µg/m³)3.332.72.52.52.83.23.956.37.27.26.76.25.85.44.94.23.53.13.13.53.73.7
CO (µg/m³)120119117114119133154179216258272235172125113117121120120121124127128124

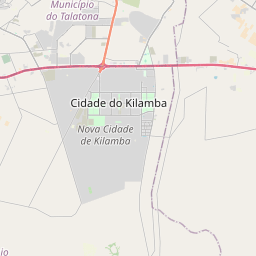
Kilamba on the map

Data Sources & Methodology

Our weather forecasts are powered by a professional weather data provider that aggregates data from national weather services, satellite observations, radar networks, and over 80,000 weather stations worldwide. Forecast data is updated multiple times daily. We convert raw data into clear summaries — wind speed in m/s, pressure in mmHg — so you can plan your day with confidence.