5-day weather forecast Kenora Nov 20, 2026

8°4° · Patchy rain possible

Weather forecast Kenora Friday Nov 20, 2026: patchy rain possible, temperature from 4 °C to 8 °C.

Precipitation probability 75%. Wind up to 4.5 m/s (gusts 10.42 m/s). Air humidity 80–98%, atmospheric pressure 750–767 mm Hg, UV index up to 0.6.

5 days at a glance — tap a day to open it
Sunrise 08:37
Sunset 17:29
Waxing Gibbous89% illuminated
Moonrise 15:16 · Moonset 03:51
Chart
Table

Forecast from 4 °C to 8 °C and precipitation

Temperature & Precipitation
Time00:0001:0002:0003:0004:0005:0006:0007:0008:0009:0010:0011:0012:0013:0014:0015:0016:0017:0018:0019:0020:0021:0022:0023:00
Temperature (°C)444444444445666655666778
Precipitation (mm/hr)0.020.020.020.010.010.020.040.050.030.020.010.030.060.070.190.150.810.480.350.530.450.530.680.54

Cloud cover and precipitation probability

Cloud cover & Rain chance
Time00:0001:0002:0003:0004:0005:0006:0007:0008:0009:0010:0011:0012:0013:0014:0015:0016:0017:0018:0019:0020:0021:0022:0023:00
Cloud cover (%)100100100100100100100100100100100100100100100100100100100100100100100100
Rain chance (%)333333333334363735343232313145407069637269727572

Wind speed and direction

Wind & Wind gust
Time00:0001:0002:0003:0004:0005:0006:0007:0008:0009:0010:0011:0012:0013:0014:0015:0016:0017:0018:0019:0020:0021:0022:0023:00
Wind (m/s)0.310.811.191.6122.312.6133.313.53.8944.394.314.54.394.54.54.394.113.813.693.613.5
Wind gust (m/s)2.532.222.923.674.475.195.816.57.147.788.539.119.510.3310.429.979.9710.1710.039.979.759.619.619.28
Wind direction (°)SSE 156°SSE 150°SE 134°SE 128°SE 126°SE 132°SE 137°SE 139°SE 139°SE 139°SE 135°SE 134°SE 134°SE 128°ESE 123°ESE 117°ESE 117°ESE 118°ESE 120°ESE 122°SE 127°SE 133°SE 141°SSE 158°

Air humidity

Humidity
Time00:0001:0002:0003:0004:0005:0006:0007:0008:0009:0010:0011:0012:0013:0014:0015:0016:0017:0018:0019:0020:0021:0022:0023:00
Humidity (%)929292939493939393939388828081869094959797989898

Atmospheric pressure

Pressure
Time00:0001:0002:0003:0004:0005:0006:0007:0008:0009:0010:0011:0012:0013:0014:0015:0016:0017:0018:0019:0020:0021:0022:0023:00
Pressure (mm Hg)766767766766766765765764764764763762761760758758757755755754753752751750

Ultraviolet index

UV Index
Time00:0001:0002:0003:0004:0005:0006:0007:0008:0009:0010:0011:0012:0013:0014:0015:0016:0017:0018:0019:0020:0021:0022:0023:00
UV Index0000000000.10.20.60.20.50.10.100000000

Air quality & pollen

Air quality
Time00:0001:0002:0003:0004:0005:0006:0007:0008:0009:0010:0011:0012:0013:0014:0015:0016:0017:0018:0019:0020:0021:0022:0023:00
PM2.5 (µg/m³)0.10.10.10.10.10.10.10.10.10.10.10.10.30.30.51.11.52.12.93.94.85.25.45.7
PM10 (µg/m³)0.20.10.20.10.10.10.10.10.10.10.10.20.30.30.61.21.62.23.24.45.35.866.3
Ozone (O₃) (µg/m³)454442414039383735353638394040414244464953576164
NO₂ (µg/m³)0.70.70.60.60.60.60.70.811.11.1111.11.21.41.722.32.52.72.72.62.3
SO₂ (µg/m³)0.30.30.20.20.20.30.30.30.30.30.30.30.30.30.30.30.30.40.40.40.50.50.50.4
CO (µg/m³)125124124124124125126130134137136133131132134136138139140140140140142145

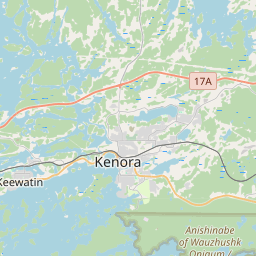
Kenora on the map

Data Sources & Methodology

Our weather forecasts are powered by a professional weather data provider that aggregates data from national weather services, satellite observations, radar networks, and over 80,000 weather stations worldwide. Forecast data is updated multiple times daily. We convert raw data into clear summaries — wind speed in m/s, pressure in mmHg — so you can plan your day with confidence.