5-day weather forecast Jaranwala Nov 16, 2026

27°16° · Smoky haze

Weather forecast Jaranwala Monday Nov 16, 2026: smoky haze, temperature from 16 °C to 27 °C.

Precipitation probability 5%. Wind up to 2.39 m/s (gusts 4.28 m/s). Air humidity 27–69%, atmospheric pressure 760–762 mm Hg, UV index up to 3.6.

Sunrise 06:34
Sunset 17:07
First Quarter52% illuminated
Moonrise 12:21 · Moonset 23:19
Chart
Table

Forecast from 16 °C to 27 °C and precipitation

Temperature & Precipitation
Time00:0001:0002:0003:0004:0005:0006:0007:0008:0009:0010:0011:0012:0013:0014:0015:0016:0017:0018:0019:0020:0021:0022:0023:00
Temperature (°C)181717161616161618212325262627262522212019181817
Precipitation (mm/hr)000000000000000000000000

Cloud cover and precipitation probability

Cloud cover & Rain chance
Time00:0001:0002:0003:0004:0005:0006:0007:0008:0009:0010:0011:0012:0013:0014:0015:0016:0017:0018:0019:0020:0021:0022:0023:00
Cloud cover (%)210100000000000000000000
Rain chance (%)455555543211110111122223

Wind speed and direction

Wind & Wind gust
Time00:0001:0002:0003:0004:0005:0006:0007:0008:0009:0010:0011:0012:0013:0014:0015:0016:0017:0018:0019:0020:0021:0022:0023:00
Wind (m/s)1.811.8921.811.691.691.51.311.111.111.191.391.6922.392.191.811.311.191.391.81222
Wind gust (m/s)2.312.442.612.532.472.422.422.392.422.532.723.143.53.864.283.672.941.721.641.862.222.422.532.5
Wind direction (°)NNW 345°NNW 344°NNW 347°N 350°N 349°NNW 347°NNW 337°NW 326°NW 313°NW 305°WNW 293°WNW 286°WNW 287°WNW 295°WNW 302°NW 306°NW 310°NW 304°WNW 297°WNW 290°WNW 289°WNW 297°NW 304°NW 309°

Air humidity

Humidity
Time00:0001:0002:0003:0004:0005:0006:0007:0008:0009:0010:0011:0012:0013:0014:0015:0016:0017:0018:0019:0020:0021:0022:0023:00
Humidity (%)656668686869666459514438343127323642454750515354

Atmospheric pressure

Pressure
Time00:0001:0002:0003:0004:0005:0006:0007:0008:0009:0010:0011:0012:0013:0014:0015:0016:0017:0018:0019:0020:0021:0022:0023:00
Pressure (mm Hg)761761761761761761761762762762762762761761760760760760760760761761761761

Ultraviolet index

UV Index
Time00:0001:0002:0003:0004:0005:0006:0007:0008:0009:0010:0011:0012:0013:0014:0015:0016:0017:0018:0019:0020:0021:0022:0023:00
UV Index000000000.31.12.13.13.63.32.41.30.40000000

Air quality & pollen

Air quality
Time00:0001:0002:0003:0004:0005:0006:0007:0008:0009:0010:0011:0012:0013:0014:0015:0016:0017:0018:0019:0020:0021:0022:0023:00
PM2.5 (µg/m³)108110.6109.4105.9101.596.696.4102.7100.483.458.13525.72321.520.622.929.941.851.95961.963.161.9
PM10 (µg/m³)118.7121.1120.1116.4111.1105.5105111.1106.989.665.442.432.52926.825.326.132.944.754.862.466.167.566.1
Ozone (O₃) (µg/m³)312726293540393642669812313413813612610992766149434038
NO₂ (µg/m³)43.545.645.341.134.529.126.92623.718.211.46.23.52.32.74.88.513.721.731.237.939.738.737
SO₂ (µg/m³)11.411.311.110.710.19.79.69.69.48.98.37.66.75.64.94.64.64.95.97.28.28.48.38
CO (µg/m³)98684973064257257573196110779697485614453633464295787228469641050108210821087

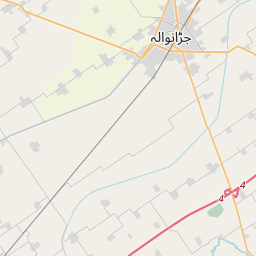
Jaranwala on the map

Data Sources & Methodology

Our weather forecasts are powered by a professional weather data provider that aggregates data from national weather services, satellite observations, radar networks, and over 80,000 weather stations worldwide. Forecast data is updated multiple times daily. We convert raw data into clear summaries — wind speed in m/s, pressure in mmHg — so you can plan your day with confidence.