5-day weather forecast Hejin Nov 7, 2026

13°6° · Smoky haze

Weather forecast Hejin Saturday Nov 7, 2026: smoky haze, temperature from 6 °C to 13 °C.

Precipitation probability 81%. Wind up to 8.39 m/s (gusts 12.33 m/s). Air humidity 50–95%, atmospheric pressure 768–773 mm Hg, UV index up to 1.

5 days at a glance — tap a day to open it
Sunrise 07:04
Sunset 17:36
New Moon2% illuminated
Moonrise 04:47 · Moonset 16:06
Chart
Table

Forecast from 6 °C to 13 °C and precipitation

Temperature & Precipitation
Time00:0001:0002:0003:0004:0005:0006:0007:0008:0009:0010:0011:0012:0013:0014:0015:0016:0017:0018:0019:0020:0021:0022:0023:00
Temperature (°C)8877766681313131312121110101010109910
Precipitation (mm/hr)000000000000000.580.120.60.951.951.150.480.40.240.07

Cloud cover and precipitation probability

Cloud cover & Rain chance
Time00:0001:0002:0003:0004:0005:0006:0007:0008:0009:0010:0011:0012:0013:0014:0015:0016:0017:0018:0019:0020:0021:0022:0023:00
Cloud cover (%)140129710057100927310010010010010010010010010010010010010010095
Rain chance (%)255131310141312131314141661336674817669655739

Wind speed and direction

Wind & Wind gust
Time00:0001:0002:0003:0004:0005:0006:0007:0008:0009:0010:0011:0012:0013:0014:0015:0016:0017:0018:0019:0020:0021:0022:0023:00
Wind (m/s)3.53.312.52.8132.52.812.692.195.118.395.317.617.694.195.394.111.191.811.610.691.110.811.5
Wind gust (m/s)4.644.225.193.53.695.033.423.335.1410.3912.3310.4212.2211.339.339.58.034.723.222.391.831.310.833.89
Wind direction (°)ESE 102°ESE 108°E 98°ESE 104°E 100°E 101°E 91°E 100°ESE 115°SE 128°SE 125°ESE 120°SE 127°SE 127°ESE 113°SE 126°SE 127°ESE 104°ESE 116°SE 134°SSE 161°SSE 165°SSW 203°WNW 283°

Air humidity

Humidity
Time00:0001:0002:0003:0004:0005:0006:0007:0008:0009:0010:0011:0012:0013:0014:0015:0016:0017:0018:0019:0020:0021:0022:0023:00
Humidity (%)505163545567565766555558586477778491929394949594

Atmospheric pressure

Pressure
Time00:0001:0002:0003:0004:0005:0006:0007:0008:0009:0010:0011:0012:0013:0014:0015:0016:0017:0018:0019:0020:0021:0022:0023:00
Pressure (mm Hg)769769769768768768768769770770769769769768768769770770771772772773773773

Ultraviolet index

UV Index
Time00:0001:0002:0003:0004:0005:0006:0007:0008:0009:0010:0011:0012:0013:0014:0015:0016:0017:0018:0019:0020:0021:0022:0023:00
UV Index000000000.10.410.80.70.50.40.30.10000000

Air quality & pollen

Air quality
Time00:0001:0002:0003:0004:0005:0006:0007:0008:0009:0010:0011:0012:0013:0014:0015:0016:0017:0018:0019:0020:0021:0022:0023:00
PM2.5 (µg/m³)59.456.754.552.751.750.850.853.455.853.751.746.944.643.943.344.947.348.752.356.960.865.269.669.2
PM10 (µg/m³)77.573.169.267.165.263.362.665.267.36571.973.369.868.263.658.260.160.36469.473.677.882.281.3
Ozone (O₃) (µg/m³)21111223613212729292620126310000
NO₂ (µg/m³)64.361.859.35754.652.249.847.444.239.133.229.629.531.734.939.645.3505354.855.454.251.649.1
SO₂ (µg/m³)41.834.428.525.12322.424.628.329.927.122.21815.613.913.21313.816.723.632.739.944.146.346
CO (µg/m³)646609591608644674694707699649577533546587616613598589590598619664724773

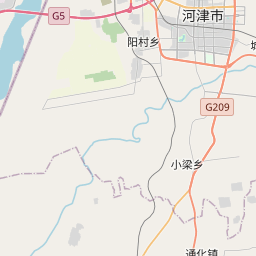
Hejin on the map

Data Sources & Methodology

Our weather forecasts are powered by a professional weather data provider that aggregates data from national weather services, satellite observations, radar networks, and over 80,000 weather stations worldwide. Forecast data is updated multiple times daily. We convert raw data into clear summaries — wind speed in m/s, pressure in mmHg — so you can plan your day with confidence.