5-day weather forecast Fort Resolution Nov 19, 2026

-3°-7° · Light snow

Weather forecast Fort Resolution tomorrow Nov 19, 2026: light snow, temperature from -7 °C to -3 °C.

Precipitation probability 47%. Wind up to 4.5 m/s (gusts 9.31 m/s). Air humidity 77–95%, atmospheric pressure 760–764 mm Hg, UV index up to 0.2.

Sunrise 09:51
Sunset 16:49
Waxing Gibbous81% illuminated
Moonrise 15:16 · Moonset 02:59
Chart
Table

Forecast from -7 °C to -3 °C and precipitation

Temperature & Precipitation
Time00:0001:0002:0003:0004:0005:0006:0007:0008:0009:0010:0011:0012:0013:0014:0015:0016:0017:0018:0019:0020:0021:0022:0023:00
Temperature (°C)-4-4-4-3-3-3-3-3-3-3-3-3-3-3-3-3-3-4-4-5-5-6-6-7
Precipitation (mm/hr)000000000.010.010.10.190.280.220.160.090.070.040.020.030.030.040.030.02

Cloud cover and precipitation probability

Cloud cover & Rain chance
Time00:0001:0002:0003:0004:0005:0006:0007:0008:0009:0010:0011:0012:0013:0014:0015:0016:0017:0018:0019:0020:0021:0022:0023:00
Cloud cover (%)44516292971001001001001001001001001001001009172646673686663
Rain chance (%)252624303132313130303943474339342822191921201917

Wind speed and direction

Wind & Wind gust
Time00:0001:0002:0003:0004:0005:0006:0007:0008:0009:0010:0011:0012:0013:0014:0015:0016:0017:0018:0019:0020:0021:0022:0023:00
Wind (m/s)3.113.313.613.8144.114.1943.813.693.813.693.693.613.53.393.693.894.194.314.394.54.394.19
Wind gust (m/s)66.677.398.148.568.899.319.038.588.148.258.177.927.617.286.977.317.758.198.568.929.229.038.86
Wind direction (°)ESE 104°E 101°E 99°E 96°E 97°E 96°E 96°E 92°E 86°E 80°E 79°ENE 77°ENE 74°ENE 69°ENE 63°ENE 58°ENE 57°NE 56°NE 55°NE 56°ENE 57°ENE 57°ENE 59°ENE 60°

Air humidity

Humidity
Time00:0001:0002:0003:0004:0005:0006:0007:0008:0009:0010:0011:0012:0013:0014:0015:0016:0017:0018:0019:0020:0021:0022:0023:00
Humidity (%)949594949392919089888685838179787979808079797877

Atmospheric pressure

Pressure
Time00:0001:0002:0003:0004:0005:0006:0007:0008:0009:0010:0011:0012:0013:0014:0015:0016:0017:0018:0019:0020:0021:0022:0023:00
Pressure (mm Hg)760761761761761761761761761761761761762762762762762763763764764764764764

Ultraviolet index

UV Index
Time00:0001:0002:0003:0004:0005:0006:0007:0008:0009:0010:0011:0012:0013:0014:0015:0016:0017:0018:0019:0020:0021:0022:0023:00
UV Index000000000000.10.20.20.1000000000

Air quality & pollen

Air quality
Time00:0001:0002:0003:0004:0005:0006:0007:0008:0009:0010:0011:0012:0013:0014:0015:0016:0017:0018:0019:0020:0021:0022:0023:00
PM2.5 (µg/m³)0.20.20.20.20.20.20.20.10.10.10.10.10.10.10.10.10.10.10.20.20.30.40.50.5
PM10 (µg/m³)0.30.30.30.30.30.20.20.20.20.10.10.10.10.10.10.10.10.20.30.30.40.50.70.8
Ozone (O₃) (µg/m³)586061626263646465656666666565646464656768697071
NO₂ (µg/m³)0.20.20.20.20.10.10.10.10.10.10.10.10.10.10.10.10.10.10.100000
SO₂ (µg/m³)00.10.10.10.10.10.100000000000000000
CO (µg/m³)115115114114113113113113112110108106104103102102102102103105106107107107

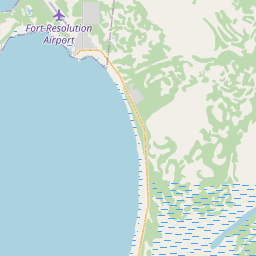
Fort Resolution on the map

Data Sources & Methodology

Our weather forecasts are powered by a professional weather data provider that aggregates data from national weather services, satellite observations, radar networks, and over 80,000 weather stations worldwide. Forecast data is updated multiple times daily. We convert raw data into clear summaries — wind speed in m/s, pressure in mmHg — so you can plan your day with confidence.