5-day weather forecast Fort Nelson Nov 20, 2026

-7°-13° · Partly cloudy

Weather forecast Fort Nelson tomorrow Nov 20, 2026: partly cloudy, temperature from -13 °C to -7 °C.

Precipitation probability 36%. Wind up to 1.69 m/s (gusts 3.53 m/s). Air humidity 83–94%, atmospheric pressure 766–767 mm Hg, UV index up to 0.3.

Sunrise 09:13
Sunset 16:39
Waxing Gibbous89% illuminated
Moonrise 14:55 · Moonset 04:00
Chart
Table

Forecast from -13 °C to -7 °C and precipitation

Temperature & Precipitation
Time00:0001:0002:0003:0004:0005:0006:0007:0008:0009:0010:0011:0012:0013:0014:0015:0016:0017:0018:0019:0020:0021:0022:0023:00
Temperature (°C)-12-12-12-12-12-13-12-12-12-12-11-10-8-7-7-7-8-10-10-11-11-11-12-12
Precipitation (mm/hr)000000000000000000000000

Cloud cover and precipitation probability

Cloud cover & Rain chance
Time00:0001:0002:0003:0004:0005:0006:0007:0008:0009:0010:0011:0012:0013:0014:0015:0016:0017:0018:0019:0020:0021:0022:0023:00
Cloud cover (%)465360708091919292928669635651402920262827334148
Rain chance (%)212223252836303131312923201816151616171717182021

Wind speed and direction

Wind & Wind gust
Time00:0001:0002:0003:0004:0005:0006:0007:0008:0009:0010:0011:0012:0013:0014:0015:0016:0017:0018:0019:0020:0021:0022:0023:00
Wind (m/s)0.890.690.50.50.390.310.190.110.110.110.310.390.6911.1910.810.6111.391.691.691.691.69
Wind gust (m/s)1.441.281.061.111.171.281.281.361.391.391.532.142.723.253.533.421.531.0622.362.812.782.692.67
Wind direction (°)NW 314°NW 311°NW 305°WNW 302°WNW 298°WNW 297°WNW 290°W 264°SW 230°ESE 116°ESE 119°ESE 119°ESE 120°ESE 119°ESE 115°ESE 110°ENE 73°E 89°ESE 107°ESE 116°SE 132°ESE 123°SE 127°SE 135°

Air humidity

Humidity
Time00:0001:0002:0003:0004:0005:0006:0007:0008:0009:0010:0011:0012:0013:0014:0015:0016:0017:0018:0019:0020:0021:0022:0023:00
Humidity (%)949393949494949494949389868483848991919293939393

Atmospheric pressure

Pressure
Time00:0001:0002:0003:0004:0005:0006:0007:0008:0009:0010:0011:0012:0013:0014:0015:0016:0017:0018:0019:0020:0021:0022:0023:00
Pressure (mm Hg)767767767767767767767767767767767767767767767767767766767767767767767767

Ultraviolet index

UV Index
Time00:0001:0002:0003:0004:0005:0006:0007:0008:0009:0010:0011:0012:0013:0014:0015:0016:0017:0018:0019:0020:0021:0022:0023:00
UV Index00000000000.10.20.30.30.2000000000

Air quality & pollen

Air quality
Time00:0001:0002:0003:0004:0005:0006:0007:0008:0009:0010:0011:0012:0013:0014:0015:0016:0017:0018:0019:0020:0021:0022:0023:00
PM2.5 (µg/m³)3.43.94.44.74.955.15.25.76.4752.91.71.3111.41.210.910.90.8
PM10 (µg/m³)3.64.14.64.95.25.35.45.55.96.67.35.23.11.81.41.11.11.41.311110.9
Ozone (O₃) (µg/m³)565452515050494949505153566163626058585959595959
NO₂ (µg/m³)3.944.143.73.63.73.844.24.44.23.32.11.31.41.82.11.91.61.31.110.9
SO₂ (µg/m³)0.40.40.40.40.30.30.30.40.40.40.30.30.20.20.10.10.10.10.10.10.10.10.10.1
CO (µg/m³)137136135132129127129132135136136135131125121120121121118113110108108107

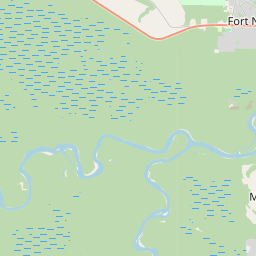
Fort Nelson on the map

Data Sources & Methodology

Our weather forecasts are powered by a professional weather data provider that aggregates data from national weather services, satellite observations, radar networks, and over 80,000 weather stations worldwide. Forecast data is updated multiple times daily. We convert raw data into clear summaries — wind speed in m/s, pressure in mmHg — so you can plan your day with confidence.