5-day weather forecast Cascavel Nov 23, 2026

26°20° · Light rain shower

Weather forecast Cascavel Monday Nov 23, 2026: light rain shower, temperature from 20 °C to 26 °C.

Precipitation probability 77%. Wind up to 3.11 m/s (gusts 7.17 m/s). Air humidity 81–99%, atmospheric pressure 755–758 mm Hg, UV index up to 7.2.

Sunrise 05:36
Sunset 19:04
Full Moon100% illuminated
Moonrise 18:12 · Moonset 04:17
Chart
Table

Forecast from 20 °C to 26 °C and precipitation

Temperature & Precipitation
Time00:0001:0002:0003:0004:0005:0006:0007:0008:0009:0010:0011:0012:0013:0014:0015:0016:0017:0018:0019:0020:0021:0022:0023:00
Temperature (°C)212121212120202121222323242526262525232322212121
Precipitation (mm/hr)0.230.050.050.090.120.230.280.791.131.411.040.670.320.270.260.310.610.450.570.10.090.080.850.06

Cloud cover and precipitation probability

Cloud cover & Rain chance
Time00:0001:0002:0003:0004:0005:0006:0007:0008:0009:0010:0011:0012:0013:0014:0015:0016:0017:0018:0019:0020:0021:0022:0023:00
Cloud cover (%)1001001001001001009910010093100100100999897959388637010083100
Rain chance (%)524848535553557377777465484941436056623941517050

Wind speed and direction

Wind & Wind gust
Time00:0001:0002:0003:0004:0005:0006:0007:0008:0009:0010:0011:0012:0013:0014:0015:0016:0017:0018:0019:0020:0021:0022:0023:00
Wind (m/s)22.11221.611.1911.111.111.191.691.891.812.112.312.52.612.312.392.192.392.612.893.11
Wind gust (m/s)3.143.613.943.783.532.863.333.924.114.335.425.926.146.286.256.316.115.335.424.645.335.476.677.17
Wind direction (°)N 357°N 3°N 4°N 0°N 0°NNW 346°NNW 337°NNW 342°NNW 347°N 9°N 3°N 9°NNE 14°N 2°N 358°N 356°N 352°N 357°N 8°NNE 33°NE 39°NE 56°NE 38°NE 41°

Air humidity

Humidity
Time00:0001:0002:0003:0004:0005:0006:0007:0008:0009:0010:0011:0012:0013:0014:0015:0016:0017:0018:0019:0020:0021:0022:0023:00
Humidity (%)989999999999999896959189868281818588939597989899

Atmospheric pressure

Pressure
Time00:0001:0002:0003:0004:0005:0006:0007:0008:0009:0010:0011:0012:0013:0014:0015:0016:0017:0018:0019:0020:0021:0022:0023:00
Pressure (mm Hg)757756756755756756757757758758758758757756755755755755755755755756756756

Ultraviolet index

UV Index
Time00:0001:0002:0003:0004:0005:0006:0007:0008:0009:0010:0011:0012:0013:0014:0015:0016:0017:0018:0019:0020:0021:0022:0023:00
UV Index00000000.51.32.22.52.84.25.25.17.24.51.90.400000

Air quality & pollen

Air quality
Time00:0001:0002:0003:0004:0005:0006:0007:0008:0009:0010:0011:0012:0013:0014:0015:0016:0017:0018:0019:0020:0021:0022:0023:00
PM2.5 (µg/m³)18.715.21211.811.313.111.57.75.44.64.54.24.34.24.955.76.888.7117.98.99
PM10 (µg/m³)18.715.312.111.911.413.311.885.64.74.74.44.54.455.15.97.18.39.111.38.19.19.2
Ozone (O₃) (µg/m³)6814181715162230394857636565636157534741363535
NO₂ (µg/m³)22.320.416.112.912.713.713.811.99.16.64.93.62.621.72.13.356.9911.212.512.511.7
SO₂ (µg/m³)2.121.81.61.61.61.61.310.70.60.50.50.40.40.40.40.50.60.811.11.21.2
CO (µg/m³)468453422400408426421369295236208197195202219243278320352368375375362342

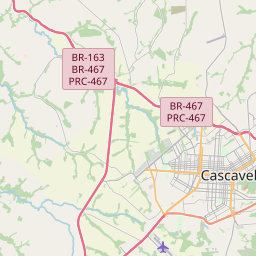
Cascavel on the map

Data Sources & Methodology

Our weather forecasts are powered by a professional weather data provider that aggregates data from national weather services, satellite observations, radar networks, and over 80,000 weather stations worldwide. Forecast data is updated multiple times daily. We convert raw data into clear summaries — wind speed in m/s, pressure in mmHg — so you can plan your day with confidence.