5-day weather forecast Capian Nov 6, 2026

17°5° · Sunny

Weather forecast Capian Friday Nov 6, 2026: sunny, temperature from 5 °C to 17 °C.

Precipitation probability 36%. Wind up to 1.81 m/s (gusts 2.61 m/s). Air humidity 45–95%, atmospheric pressure 766–768 mm Hg, UV index up to 1.9.

5 days at a glance — tap a day to open it
Sunrise 07:46
Sunset 17:43
Waning Crescent6% illuminated
Moonrise 04:29 · Moonset 16:02
Chart
Table

Forecast from 5 °C to 17 °C and precipitation

Temperature & Precipitation
Time00:0001:0002:0003:0004:0005:0006:0007:0008:0009:0010:0011:0012:0013:0014:0015:0016:0017:0018:0019:0020:0021:0022:0023:00
Temperature (°C)7677577578813151417171514111010978
Precipitation (mm/hr)000000000000000000000000

Cloud cover and precipitation probability

Cloud cover & Rain chance
Time00:0001:0002:0003:0004:0005:0006:0007:0008:0009:0010:0011:0012:0013:0014:0015:0016:0017:0018:0019:0020:0021:0022:0023:00
Cloud cover (%)0319758198100923318610085824950300480
Rain chance (%)121514233329293616122043628734957189

Wind speed and direction

Wind & Wind gust
Time00:0001:0002:0003:0004:0005:0006:0007:0008:0009:0010:0011:0012:0013:0014:0015:0016:0017:0018:0019:0020:0021:0022:0023:00
Wind (m/s)1.51.191.311.51.391.811.611.391.191.1110.690.390.190.310.610.611.51.610.691.1111.111.11
Wind gust (m/s)1.51.751.311.51.891.831.612.361.191.422.6110.812.080.921.112.081.611.611.441.111.111.671.11
Wind direction (°)SE 127°SE 144°ESE 122°ESE 115°SE 136°SSE 160°S 178°SSE 155°SSE 162°SSE 161°SSE 149°SSE 159°SE 139°SE 135°WNW 287°NW 312°N 7°NNW 345°N 357°NE 48°N 9°NNE 14°E 82°NE 46°

Air humidity

Humidity
Time00:0001:0002:0003:0004:0005:0006:0007:0008:0009:0010:0011:0012:0013:0014:0015:0016:0017:0018:0019:0020:0021:0022:0023:00
Humidity (%)869487889589889589838863566947456052608068738978

Atmospheric pressure

Pressure
Time00:0001:0002:0003:0004:0005:0006:0007:0008:0009:0010:0011:0012:0013:0014:0015:0016:0017:0018:0019:0020:0021:0022:0023:00
Pressure (mm Hg)766767767767767767767767767767768768768767767767767767767767768768768768

Ultraviolet index

UV Index
Time00:0001:0002:0003:0004:0005:0006:0007:0008:0009:0010:0011:0012:0013:0014:0015:0016:0017:0018:0019:0020:0021:0022:0023:00
UV Index0000000000.20.61.11.71.91.71.20.60.2000000

Air quality & pollen

Air quality
Time00:0001:0002:0003:0004:0005:0006:0007:0008:0009:0010:0011:0012:0013:0014:0015:0016:0017:0018:0019:0020:0021:0022:0023:00
PM2.5 (µg/m³)21.320.222.12118.315.914.615.918.520.720.721.219.713.69.57.26.89.315.421.727.231.733.434.2
PM10 (µg/m³)22.621.523.722.219.316.815.516.318.720.820.821.42014.610.98.78.410.717.123.52933.335.236.1
Ozone (O₃) (µg/m³)8.56.34571218222220223145566775755730104454
NO₂ (µg/m³)31.335.237.63531.726.921.417.316.216.515.912.995.92.60.13.41838.452.855.45248.446.5
SO₂ (µg/m³)1.31.110.90.70.60.60.50.40.20.20.30.50.70.70.60.711.41.722.22.22
CO (µg/m³)310.5316.8323317305285260239229225218205189176161149158208279331347343331306

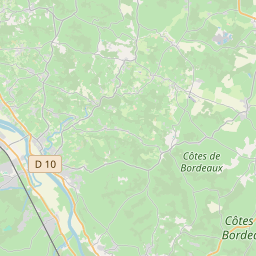
Capian on the map

Data Sources & Methodology

Our weather forecasts are powered by a professional weather data provider that aggregates data from national weather services, satellite observations, radar networks, and over 80,000 weather stations worldwide. Forecast data is updated multiple times daily. We convert raw data into clear summaries — wind speed in m/s, pressure in mmHg — so you can plan your day with confidence.