5-day weather forecast Canutama Nov 20, 2026

35°25° · Thundery outbreaks possible

Weather forecast Canutama Friday Nov 20, 2026: thundery outbreaks possible, temperature from 25 °C to 35 °C.

Precipitation probability 67%. Wind up to 2.11 m/s (gusts 6.25 m/s). Air humidity 49–98%, atmospheric pressure 753–758 mm Hg, UV index up to 13.1.

Sunrise 05:49
Sunset 18:15
Waxing Gibbous89% illuminated
Moonrise 14:50 · Moonset 02:23
Chart
Table

Forecast from 25 °C to 35 °C and precipitation

Temperature & Precipitation
Time00:0001:0002:0003:0004:0005:0006:0007:0008:0009:0010:0011:0012:0013:0014:0015:0016:0017:0018:0019:0020:0021:0022:0023:00
Temperature (°C)252525252525252627303334343535353433302725252525
Precipitation (mm/hr)0.400.0500.0200000.040.080.120.120.110.110.080.040.010.250.730.720.480.240.74

Cloud cover and precipitation probability

Cloud cover & Rain chance
Time00:0001:0002:0003:0004:0005:0006:0007:0008:0009:0010:0011:0012:0013:0014:0015:0016:0017:0018:0019:0020:0021:0022:0023:00
Cloud cover (%)5810010010010075879374725252555950548863758187909174
Rain chance (%)504348434528353021161717171717171410305967675567

Wind speed and direction

Wind & Wind gust
Time00:0001:0002:0003:0004:0005:0006:0007:0008:0009:0010:0011:0012:0013:0014:0015:0016:0017:0018:0019:0020:0021:0022:0023:00
Wind (m/s)0.890.610.610.50.310.190.610.390.611.111.391.611.51.391.311.311.311.812.111.691.391.111.51.19
Wind gust (m/s)2.191.721.581.721.331.252.082.032.443.644.174.814.54.143.973.923.923.646.255.616.174.533.973.86
Wind direction (°)ENE 70°NE 56°N 9°N 7°NNW 345°N 5°NNE 16°N 4°NNE 21°NNE 14°N 11°NNE 15°NNE 17°NNE 15°NNE 16°NNE 28°NNE 28°ENE 65°ENE 67°NE 49°NNE 28°NNE 29°NE 39°NNE 29°

Air humidity

Humidity
Time00:0001:0002:0003:0004:0005:0006:0007:0008:0009:0010:0011:0012:0013:0014:0015:0016:0017:0018:0019:0020:0021:0022:0023:00
Humidity (%)989898989898969385706053535149515662748696969798

Atmospheric pressure

Pressure
Time00:0001:0002:0003:0004:0005:0006:0007:0008:0009:0010:0011:0012:0013:0014:0015:0016:0017:0018:0019:0020:0021:0022:0023:00
Pressure (mm Hg)757756756756756756757758758758758758757756755754753753754755755756756757

Ultraviolet index

UV Index
Time00:0001:0002:0003:0004:0005:0006:0007:0008:0009:0010:0011:0012:0013:0014:0015:0016:0017:0018:0019:0020:0021:0022:0023:00
UV Index00000000.41.84.67.810.413.16.82.21.11.10.70.100000

Air quality & pollen

Air quality
Time00:0001:0002:0003:0004:0005:0006:0007:0008:0009:0010:0011:0012:0013:0014:0015:0016:0017:0018:0019:0020:0021:0022:0023:00
PM2.5 (µg/m³)6.56.66.56.266.16.46.36.26.377.17.47.88.38.78.98.88.88.58.38.17.66.8
PM10 (µg/m³)6.66.76.66.366.26.56.56.36.57.37.37.78.18.79.19.39.198.78.48.37.66.9
Ozone (O₃) (µg/m³)1312111088101418212528323739383431292725242424
NO₂ (µg/m³)0.30.30.30.30.40.40.30.30.20.20.20.20.20.20.20.30.40.40.40.30.20.20.20.2
SO₂ (µg/m³)0.10.10.10.10.10.10.10.20.20.20.30.30.30.40.40.40.30.30.30.20.20.20.20.2
CO (µg/m³)114114113113113113113114114114113113113112112112113113113114114115116117

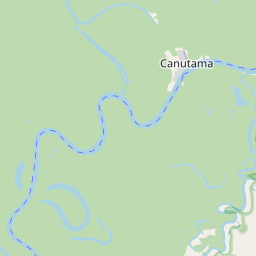
Canutama on the map

Data Sources & Methodology

Our weather forecasts are powered by a professional weather data provider that aggregates data from national weather services, satellite observations, radar networks, and over 80,000 weather stations worldwide. Forecast data is updated multiple times daily. We convert raw data into clear summaries — wind speed in m/s, pressure in mmHg — so you can plan your day with confidence.