5-day weather forecast New York Nov 5, 2026

21°16° · Overcast

Weather forecast New York Thursday Nov 5, 2026: overcast, temperature from 16 °C to 21 °C.

Precipitation probability 69%. Wind up to 3.81 m/s (gusts 12.11 m/s). Air humidity 74–94%, atmospheric pressure 759–763 mm Hg, UV index up to 1.2.

Sunrise 06:31
Sunset 16:48
Waning Crescent13% illuminated
Moonrise 02:24 · Moonset 14:41
Chart
Table

Forecast from 16 °C to 21 °C and precipitation

Temperature & Precipitation
Time00:0001:0002:0003:0004:0005:0006:0007:0008:0009:0010:0011:0012:0013:0014:0015:0016:0017:0018:0019:0020:0021:0022:0023:00
Temperature (°C)171616161616161617182018192119192118181918181918
Precipitation (mm/hr)0000000000.040.410.590.0500.170.01000000.060.220.67

Cloud cover and precipitation probability

Cloud cover & Rain chance
Time00:0001:0002:0003:0004:0005:0006:0007:0008:0009:0010:0011:0012:0013:0014:0015:0016:0017:0018:0019:0020:0021:0022:0023:00
Cloud cover (%)10053100100591001001001009798100100969910056111007610010092100
Rain chance (%)292031302231303028305269321945291314292031374869

Wind speed and direction

Wind & Wind gust
Time00:0001:0002:0003:0004:0005:0006:0007:0008:0009:0010:0011:0012:0013:0014:0015:0016:0017:0018:0019:0020:0021:0022:0023:00
Wind (m/s)3.112.69332.52.692.612.612.893.313.813.613.813.693.692.812.692.312.6132.1122.691.89
Wind gust (m/s)9.927.1910.7211.727.2211.3310.037.0811.22119.1912.11119.9710.229.927.648.398.617.254.545.723.72
Wind direction (°)SSW 201°SSW 197°S 191°SSW 202°SSW 198°SSW 195°S 187°SSW 200°SSW 196°SSW 199°SSW 193°SSW 195°SSW 197°SSW 207°SSW 207°SSW 212°S 191°S 189°S 190°SSW 194°S 187°SSE 163°SSW 196°SSW 192°

Air humidity

Humidity
Time00:0001:0002:0003:0004:0005:0006:0007:0008:0009:0010:0011:0012:0013:0014:0015:0016:0017:0018:0019:0020:0021:0022:0023:00
Humidity (%)899091919391919187857790867485887790908393938794

Atmospheric pressure

Pressure
Time00:0001:0002:0003:0004:0005:0006:0007:0008:0009:0010:0011:0012:0013:0014:0015:0016:0017:0018:0019:0020:0021:0022:0023:00
Pressure (mm Hg)763762762761761761761761761761761761761760760760759760760760760760760759

Ultraviolet index

UV Index
Time00:0001:0002:0003:0004:0005:0006:0007:0008:0009:0010:0011:0012:0013:0014:0015:0016:0017:0018:0019:0020:0021:0022:0023:00
UV Index000000000.10.41.20.40.90.80.80.20.10000000

Air quality & pollen

Air quality
Time00:0001:0002:0003:0004:0005:0006:0007:0008:0009:0010:0011:0012:0013:0014:0015:0016:0017:0018:0019:0020:0021:0022:0023:00
PM2.5 (µg/m³)13.212.51211.811.912.614.618.319.719.218.217.917.316.515.11413.715.115.513.611.410.710.410.3
PM10 (µg/m³)15.114.41413.713.914.716.920.621.821.621.322.222.120.918.317.616.617.417.315.112.611.911.611.3
Ozone (O₃) (µg/m³)27323230261911812213038475252494333211312151821
NO₂ (µg/m³)474037.237.13944.752.55755.450.44539.132.728.828.430.434.642.853.259.96056.452.147.2
SO₂ (µg/m³)1.91.81.81.81.92.12.52.72.82.92.92.72.52.32.22.1222.12.22.22.12.12.1
CO (µg/m³)164153143136145187244276260219185167154150158174184183177170162153145138

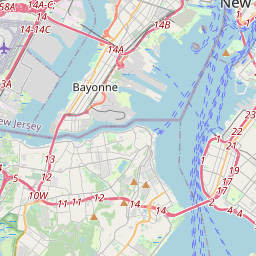
New York on the map

Data Sources & Methodology

Our weather forecasts are powered by a professional weather data provider that aggregates data from national weather services, satellite observations, radar networks, and over 80,000 weather stations worldwide. Forecast data is updated multiple times daily. We convert raw data into clear summaries — wind speed in m/s, pressure in mmHg — so you can plan your day with confidence.